
Figure 3. TFV-DP levels in epithelial cells FRT endometrium, endocervix and ectocervix tissue.
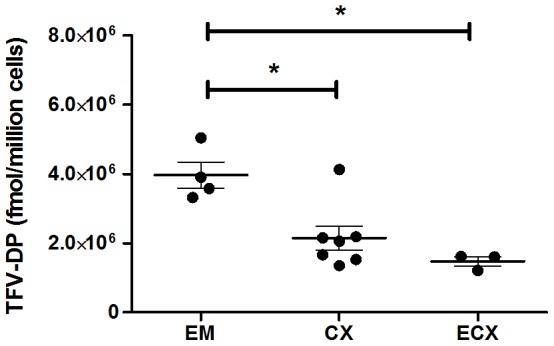
TFV-DP levels were measured by LC-MS/MS in purified cultures of EM (n = 4), CX (n = 7) and ECX (n = 3) epithelial cells treated with TFV (1 mg/ml) for 24 hr. Each circle represents an individual patient. Values are expressed as fmol/million cells. The mean and SEM are shown. *, p<0.05.