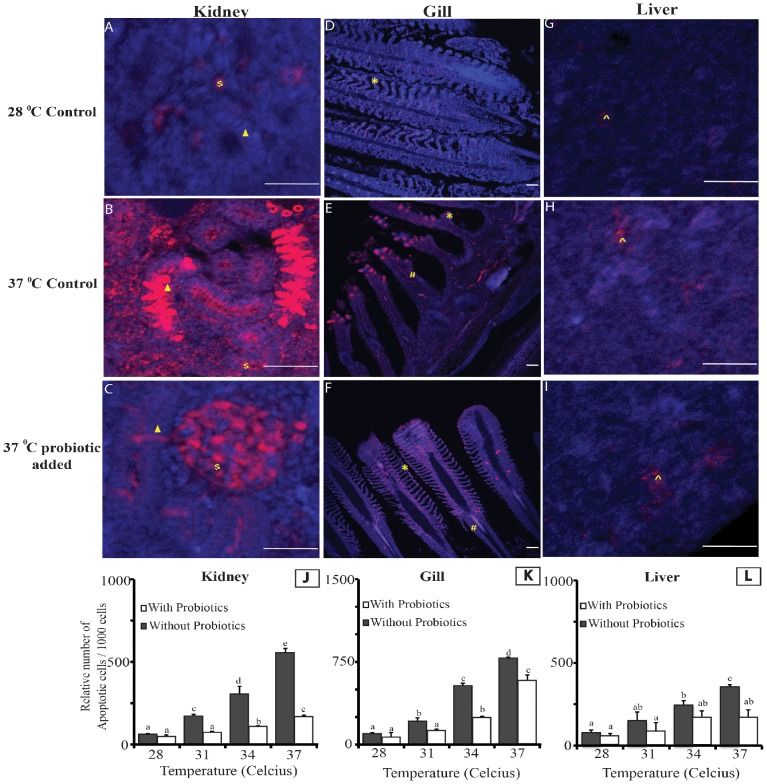
Figure 2. Analysis of the effects of temperature and probiotic supplementation on apoptosis in Kidney (A–C), Gill (D–F) and Liver (G–I).
The apoptotic cells are represented by red color while blue color represents the juxtaposed cell nucleus. Note: Different cell types i.e. nephrons, interstitial cells of kidney, primary gill lamellae, secondary gill lamellae and apoptotic hepatic cells are respectively marked with ▴, $, #, * and ∧. Bar length- 50 micron. J–L shows the relative apoptotic cell density in the kidney, gill and liver at different temperature. Each value represents Mean ±SE of three biological replicates (n = 3), each replicate prepared from four fish. Briefly, the mean data from 4 fish (from same treatment replicate) were used for calculating the biological average apoptotic cell count. The average data generated from three such biological averages (n = 3) were used for statistical analysis. Significance between the treatments was determined by Duncan's Multiple Range Test (DMRT) using SPSS (Version 16.0).

