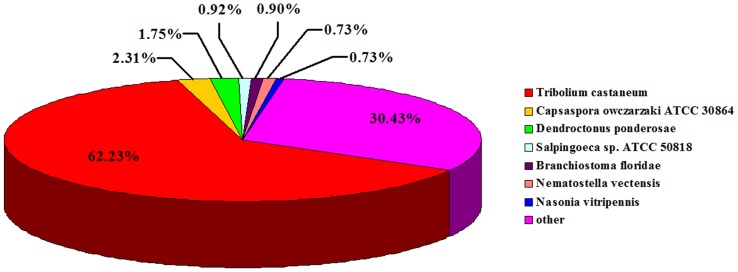
Figure 2. Species distribution of Blastx matches (with an E-value <10−5) to the unigenes against nr.
Species distribution is shown as the percentage of total homologous sequences with an E-value of at least 10−5. We used the first hit of each sequence for analysis. Different colors represent different species.

