
Figure 1. Expression level of eHSPA12B in the plasma of septic mice.
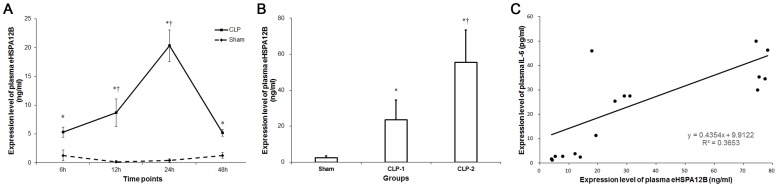
A. Plasma levels of eHSPA12B in septic mice. eHSPA12B was elevated at 6(n = 6 for each time points of the 2 groups). * p<0.001, compared with sham group; † p<0.001, compared with the level at 6h. Data analyses with Student’s t-test. B. Plasma level of eHSPA12B in mice with sepsis of different severity. CLP-1, mice with once puncture in the cecum; CLP-2, mice with twice punctures in the cecum. * p<0.001, compared with sham group; † p<0.001, compared with CLP-1 group. Data analyses with ANOVA test. C. Relationship between the levels of eHSPA12B and IL-6 (p<0.001). Data analyses with Pearson’s correlation analysis.