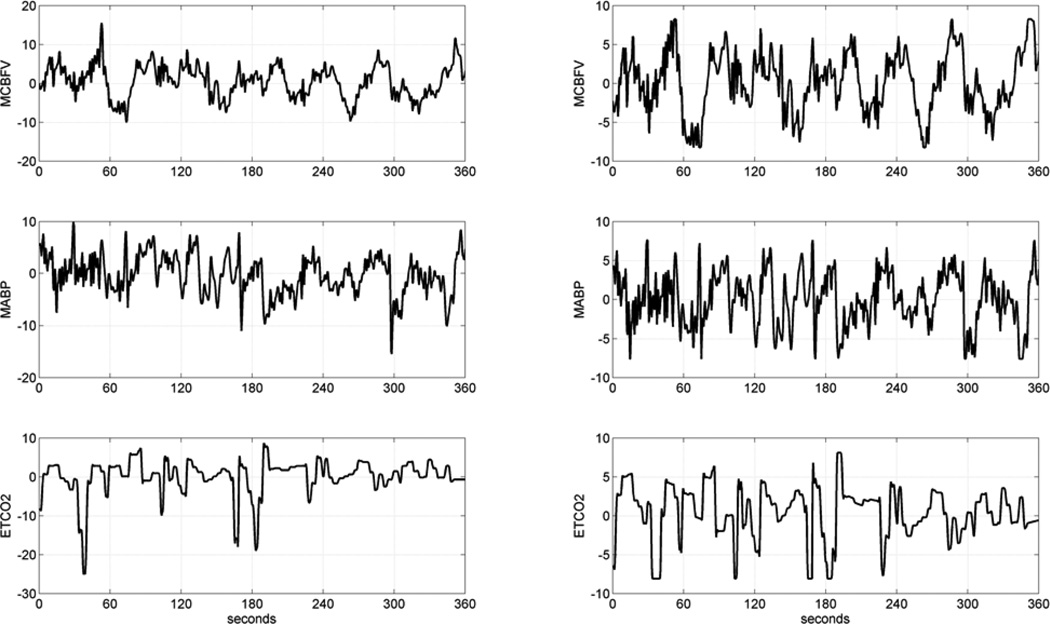
Figure 1.
Illustrative time-series data over 6 min of a typical MCI patient, representing beat-to-beat spontaneous variations of MCBFV (top), MABP (middle) and ETCO2 (bottom). The raw data are on the left column and the pre-processed data are on the right column. The units of the ordinate axis are: cm/sec for MCBFV and mmHg for MABP and ETCO2.

