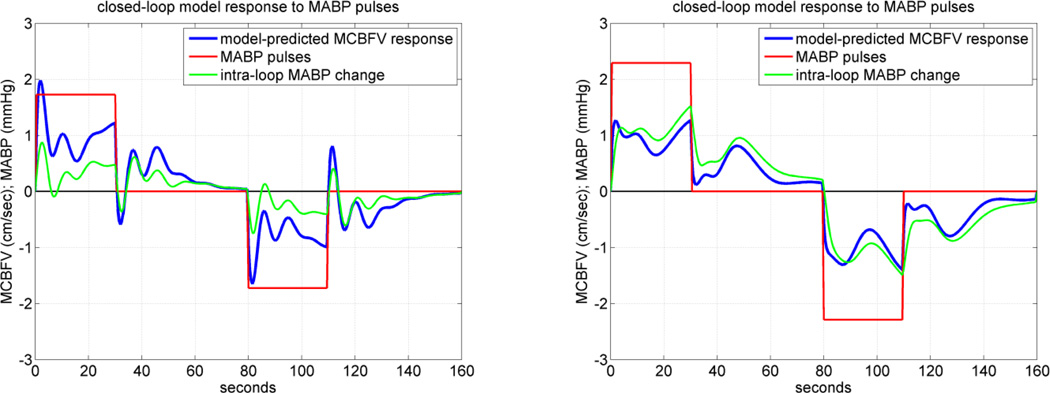
Figure 8.
The closed-loop model-predicted MCBFV response (blue line) for a representative CS (left panel) and MP (right panel) to a positive MABP pulse stimulus over the time-interval 0–30 sec (red line), equal to half SD of the recorded MABP data, and to a negative MABP pulse stimulus of the same magnitude over the time-interval 80–110 sec, while the ETCO2 input is kept at zero. The externally imposed MABP pulse stimulus induces an intra-loop MABP change which is plotted in green. Normal pressure autoregulation is observed for the CS (left) but not for the MP (right) (see text).

