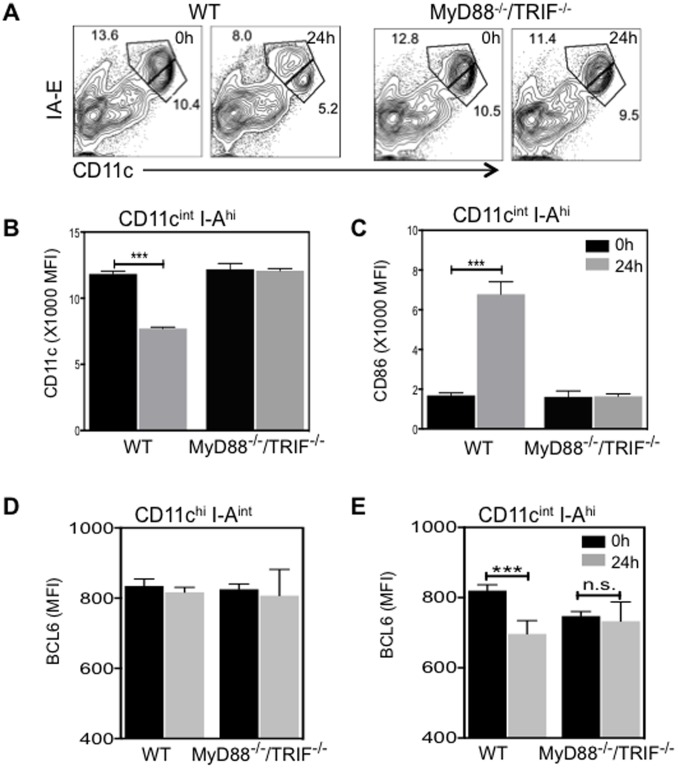
Figure 7. LPS-induced rapid reduction of BCL6 levels does not occur in MyD88−/− TRIF−/− mice.
WT or MyD88−/− TRIF−/− mice were i.p. injected with LPS. (A) Representative FACS plots (n = 4) showing CD11c and I-A/E expression on splenic cells in 0 h or 24 h post-LPS injected mice. (B) and (C) The MFI±SEM (n = 4) of CD11c (B) and CD86 (C) in gated splenic CD11cint I-Ahi cells obtained from either WT or MyD88−/− TRIF−/− mice 0 h (black bar) or 24 h after (grey bar) LPS injection. (D) and (E) The average MFI ±SEM (n = 4) of BCL6 in CD11chi I-Aint (D) and CD11cint I-Ahi (E) cells 0 h (black bar) and 24 h after (grey bar) LPS injection. ***p<0.001 (two way ANOVA) was compared within each group.

