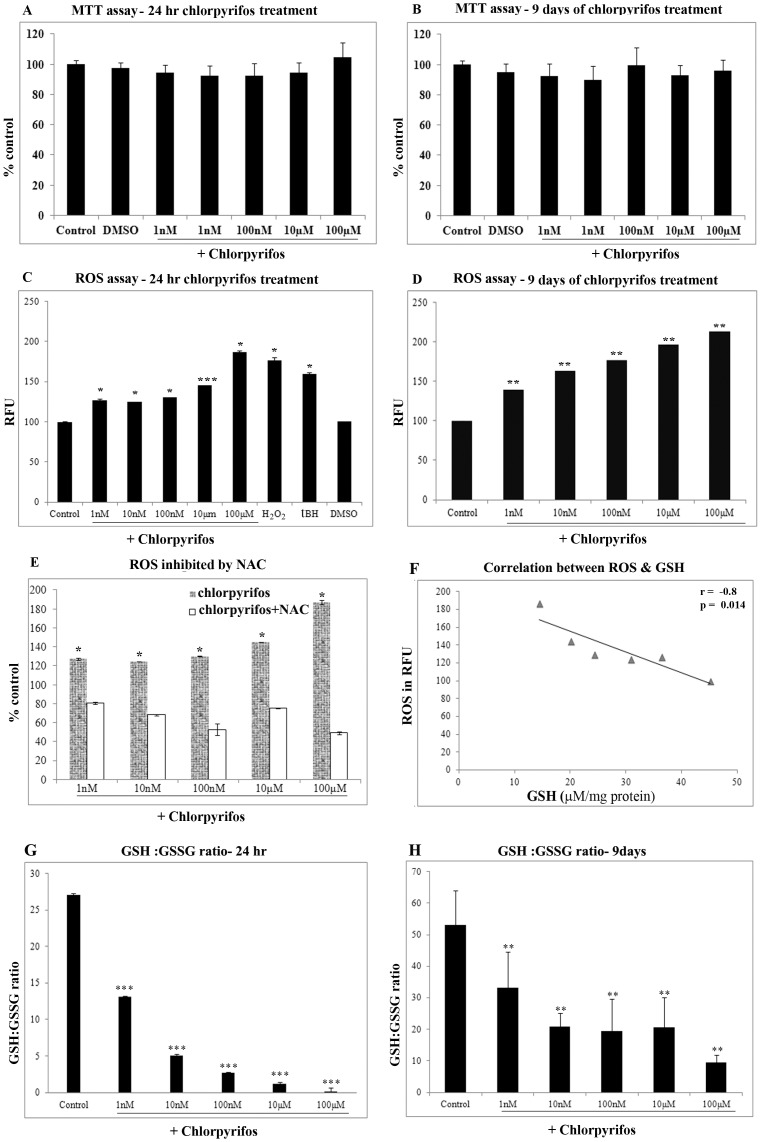
Figure 1. Effect of chlorpyrifos on cell viability and oxidative stress in ARPE19 cells.
Effect of chlorpyrifos on cell viability in ARPE19 cells was assessed using MTT assays (A) after 24 hr chlorpyrifos treatment, (B) After 9 days of chlorpyrifos treatment. (C) ROS production measured by the DCFDA method in ARPE19 cells after 24 hr chlorpyrifos treatment. DMSO was the vehicle control used. tBH (500 µM) and H2O2 (1 mM) was the positive control for ROS generation, (D) ROS production after 9 days of chlorpyrifos treatment. (E) ROS production measured in ARPE19 cells pretreated with NAC & exposed to chlorpyrifos. (F) Negative correlation between ROS generation and the GSH level upon chlorpyrifos treatment. Dose-dependent response of the GSH/GSSG ratio to chlorpyrifos exposure (G) for 24 hr (H) after 9 days of chlorpyrifos treatment. p values are the comparison between treated control and the respective treatments. * p<0.05, ** p<0.01, *** p<0.001. All value expressed are a mean of 3 experiments done in triplicates and the values are expressed as Mean ±SD.

