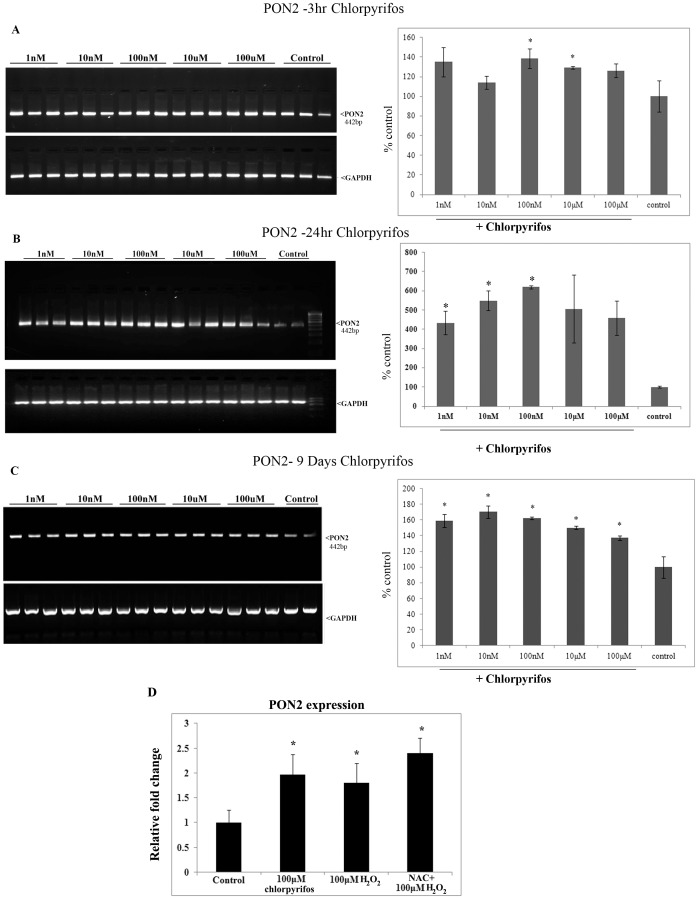
Figure 2. Expression of PON2 in ARPE19 cells upon chlorpyrifos exposure.
(A) Expression of PON2 at 3 hr chlorpyrifos exposure. (B) PON2 at 24 hr chlorpyrifos exposure. (C) PON2 at 9 days of chlorpyrifos exposure. PCR product is visualized on ETBR gel and the Histogram represents the quantification of PCR band normalized to the GAPDH. (D) Relative quantification of PON2 expression after exposure to 100 µM chlorpyrifos and 100 µM of H2O2 with and without pretreatment with 5 mM NAC. Histogram represents the fold change after normalization to the GAPDH. All value expressed are a mean of 3 experiments done in triplicates and the values are expressed as Mean ±SD. p values are the comparison between treated control and the respective treatments.*p<0.05, t test.

