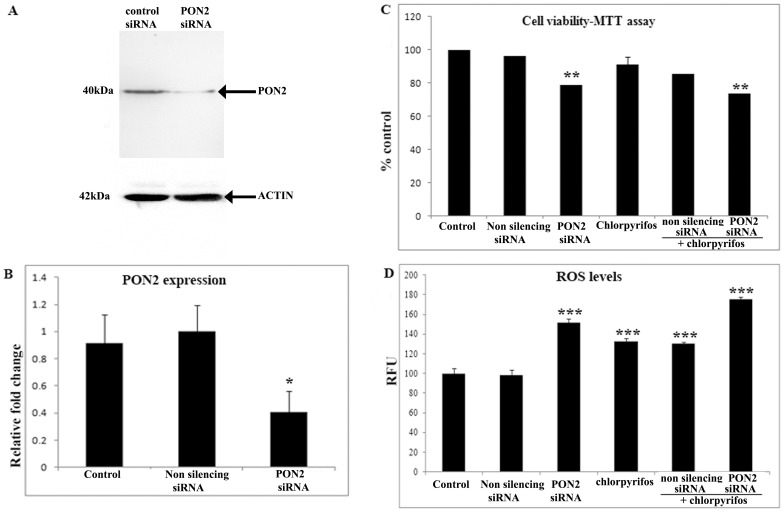
Figure 4. Silencing PON2 expression causes cell death and increases the ROS production.
(A) Immunoblot analysis of PON2 from ARPE19 cells transfected with PON2 and non silencing siRNA. β ACTIN used for normalizing the protein load. (B) Histogram represents the expression of PON2 in the control and siRNA treated ARPE19 cells as fold change obtained from the qRT PCR. (C) Effect of 100 µM chlorpyrifos on cell viability in ARPE19 cells where PON2 expression was silenced using siRNA. (D) ROS production measured by the DCFDA method in ARPE19 cells transfected with PON2 siRNA or non silencing siRNA and exposed to chlorpyrifos for 24 hr. All value expressed are a mean of 3 experiments done in triplicates and the values are expressed as Mean ±SD. p values are the comparison between treated control and the respective treatments.*p<0.05, **p<0.01, ***p<0.001, t test.

