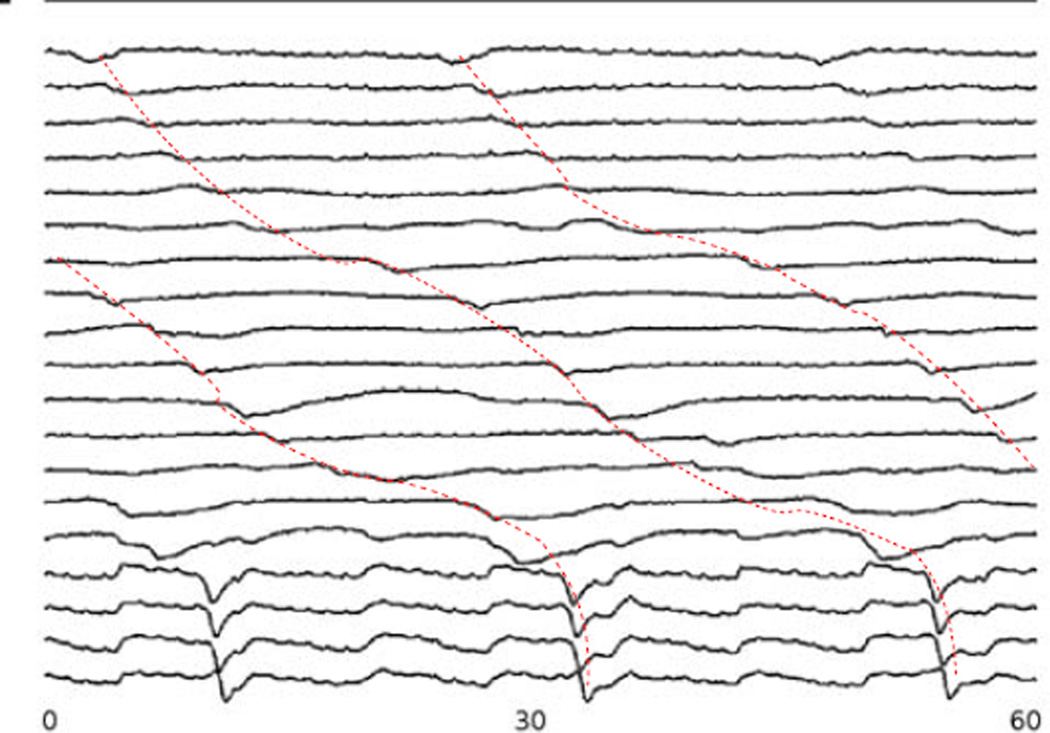
Fig. 2.
Signals from gastric serosal recordings for a period of 60 s. The signals show propagation down the longitudinal axis of the stomach (as indicated by the dotted red line) as well as the presence of 2–3 simultaneous waves at a given instance in time. Locations of the electrodes are shown in Fig. 3 via the marked electrodes along with the activation pattern of one slow wave.

