
FIG. 2.
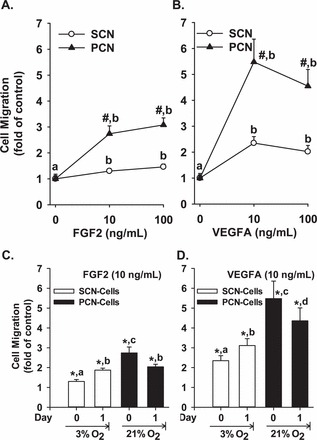
FGF2- and VEGFA-stimulated SCN and PCN cell migration. A, B) SCN and PCN cells were cultured in 21% and 3% O2 respectively. C, D) SCN and PCN cells were preincubated in 3% and 21% O2, respectively, for 24 h (note: the O2 levels were reversed). After serum starvation, cells were treated with FGF2 and VEGFA, followed by the migration assays. Data are expressed as the means ± SEM fold change of the no growth factor control. #Differ from SCN at each corresponding dose (P < 0.05). *Differ from the corresponding no growth factor control. a,b,c,d Means with different letters differ from each other in SCN or PCN cells (A–D) (P < 0.05); n = 6 pairs of cell preparations.