
FIG. 2.
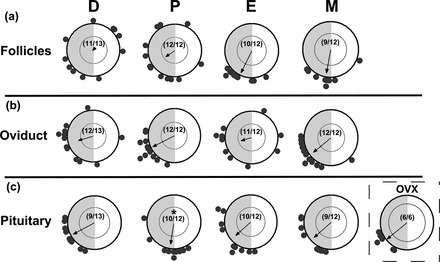
Rhythms of per1-luciferase expression in ovarian follicles, oviduct, and pituitary gland are differentially affected by estrous cycle stage and OVX. Rayleigh plots of peak per1-luc expression from individual follicular (a), oviduct (b), and pituitary (c) tissue cultures from each day of the estrous cycle or OVX rats. The asterisk in c indicates significant differences between the mean phase of per1-luc expression in pituitary gland explants collected on proestrus versus tissues collected on diestrus or estrus or from OVX rats (P < 0.05). All abbreviations and conventions are as described in Figure 1.