
FIG. 4.
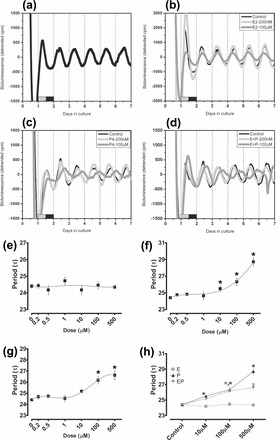
Ovarian steroid hormones at physiological levels do not affect the period of per1-luciferase expression in SCN tissue cultures. a) Recording of per1-luc luminescence in a vehicle-treated SCN tissue culture (peak phase ∼ZT9, τ = 24.2). b) Per1-luc expression in SCN explants treated with low (200 nM; light gray trace) and high (100 μM; dark gray trace) concentrations of E2 or vehicle (black trace) control. c) Per1-luc expression in SCN explants treated with low (200 nM; light gray trace) and high (100 μM; dark gray trace) concentrations of P4 or vehicle (black trace). d) Per1-luc expression in SCN explants treated with low (200 nM; light gray trace) and high (100 μM; dark gray trace) concentrations of E2+P4 or vehicle (black trace). e) Treatment with E2 alone (200 nM–500 μM) did not affect the period of per1-luc expression in the SCN. f) Treatment with P4 at or above 10 μM lengthened the period of per1-luc expression. g) Treatment with high concentrations of E2+P4 also lengthened the period of per1-luc expression. h) Although P4 (black triangles) and E2+P4 (inverted gray triangles) lengthened the period of per1-luc expression, the effects of P4 were slightly attenuated by the addition of E2 (gray squares). In a–d, the black trace is the vehicle control shown in a. In all figures the light-dark bar on the x-axis represents the light-dark cycle on the day of tissue collection. In e–h, *P < 0.05 versus vehicle control. In h, gray asterisks = P < 0.05 for E2+P4 treatment versus E2, and black asterisks = P < 0.05 for P4 treatment versus E2 treatment. All data in e–h are mean ± SEM.