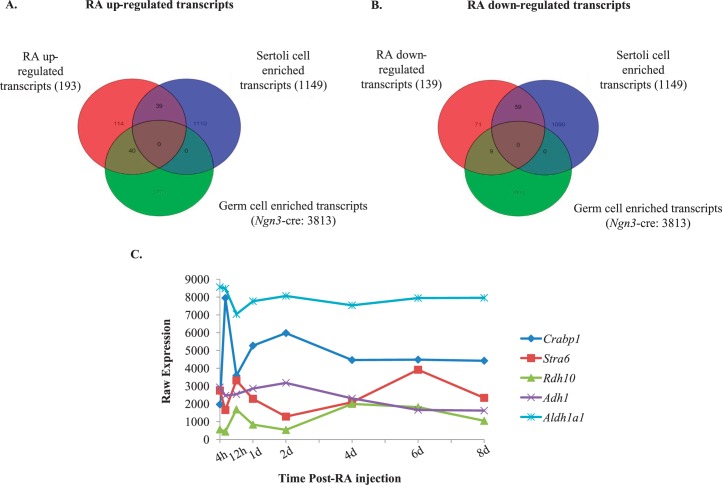
FIG. 6.
Retinoic acid (RA)-regulated germ and Sertoli cell transcripts. Venn diagram for all RA up-regulated (A) or down-regulated (B) germ (RiboTag/Ngn3-cre) or Sertoli (RiboTag/Amh-cre) cell transcripts. The Sertoli cell-enriched transcripts were determined by comparing the IP mRNA to the total mRNA in all the time points assayed, whereas germ cell-enriched transcripts were identified by comparing WIN 18,446-only and WIN 18,446/RA-treated testes left to recover for 4 h. C) Graph depicting the microarray expression pattern of the top five retinoid metabolism transcripts that significantly change in expression during the first wave of synchronized spermatogenesis. Significance was determined by an ANOVA test (P < 0.05) compared to WIN 18,446-only (0 h) treatment. Raw expression values are represented on the y-axis, and time post-RA injection is given on the x-axis.

