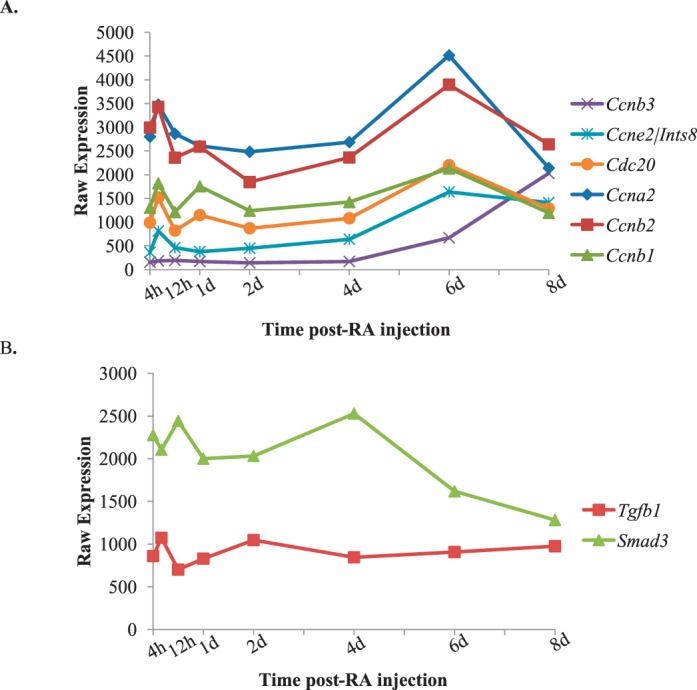
FIG. 8.

Actively translated cell cycle transcripts during the first wave of spermatogenesis. Graphs depicting the microarray expression patterns of actively translated germ cell-enriched cyclins (A) and actively translated Sertoli cell cycle transcripts, Tgfb1 and Smad3, (B) across the first wave of synchronized spermatogenesis. Raw expression values are represented on the y-axis, and time post-RA injection is given on the x-axis.
