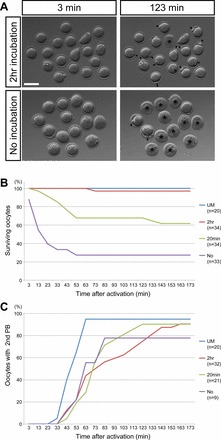
FIG. 3.

Time-lapse videomicroscopy of vitrified oocytes after parthenogenetic activation. A) Snapshot images of time-lapse recording of activated oocytes that have been vitrified and thawed. The top row shows images of activated oocytes that have been incubated for 2 h in KSOM after T5, and the bottom row shows images of those that have been activated soon after T5 without incubation. Asterisks indicate dead oocytes, and arrowheads point to the second polar body. Bar = 100 μm. B) Time course of survival of activated oocytes that have been incubated in KSOM for different durations. C) Time course of the second polar body (second BP) emission in surviving oocytes after activation. UM, unmanipulated oocytes. No, no incubation or less than 1 min of incubation.
