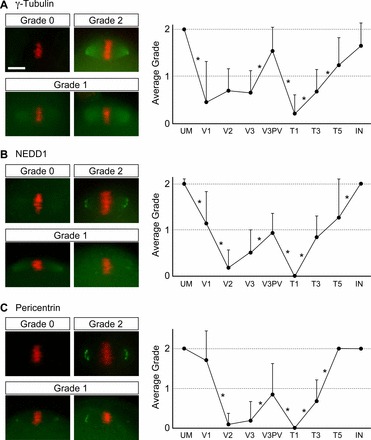
FIG. 4.

Disappearance and reappearance of MTOC components during oocyte vitrification process. A) γ-Tubulin. B) NEDD1. C) Pericentrin. Localizations of each MTOC component are scored based on their grades: grade 0 = no detectable localization, grade 1 = diminished and/or diffused localization, grade 2 = normal distribution. Representative images for each grade are shown on the left (green for the MTOC components and red for chromosomes). Graphs showing average grades of each MTOC component are shown on the right. Error bars represent standard deviations. Numbers of oocyte examined for each step are: UM (unmanipulated; n = 25, 53 and 36 [for γ-Tubulin, NEDD1, and Pericentrin, respectively]), V1 (n = 9, 16, and 7), V2 (n = 16, 23, and 22), V3 (n = 28, 32, and 39), V3PV (postvitrification; n = 13, 17, and 13), T1 (n = 25, 25, and 24), T3 (n = 27, 25, and 20), T5 (n = 13, 16, and 13), IN (incubation for 2 h at 37°C; n = 20, 16, and 12). Distributions of grades are compared between two adjacent steps by Student t-test, and asterisks represent statistically significant changes (P < 0.05). Bar = 10 μm.
