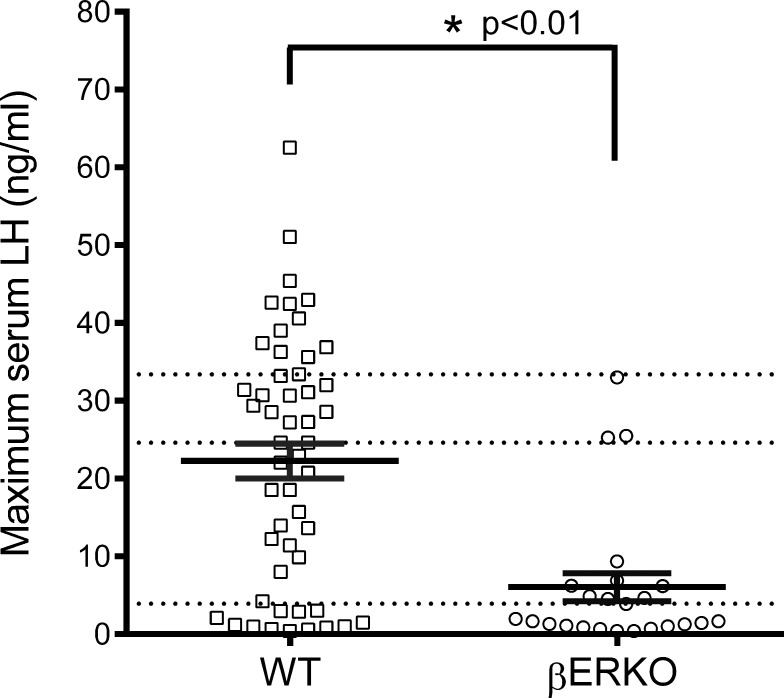
FIG. 3.
Maximum LH measured in βERKO mice is significantly decreased relative to WT mice. Maximum LH values of LH surges detected in blood samples from WT and βERKO mice in the evening of proestrus. The solid bars represents the mean ± SEM, while the individual markers represent the distribution of all values (WT, n = 51; βERKO, n = 24). The distribution of WT maximum LH into quartiles is indicated by the horizontal dotted lines, and the percentile distributions of maximum LH values for βERKO within those quartiles are lowest quartile (58.3%), second quartile (29.2%), third quartile (12.5%), and fourth quartile (0%). Quartile distributions were analyzed by chi-square analysis. *P < 0.01. Maximum LH was compared using Mann-Whitney test; P-values are two sided.

