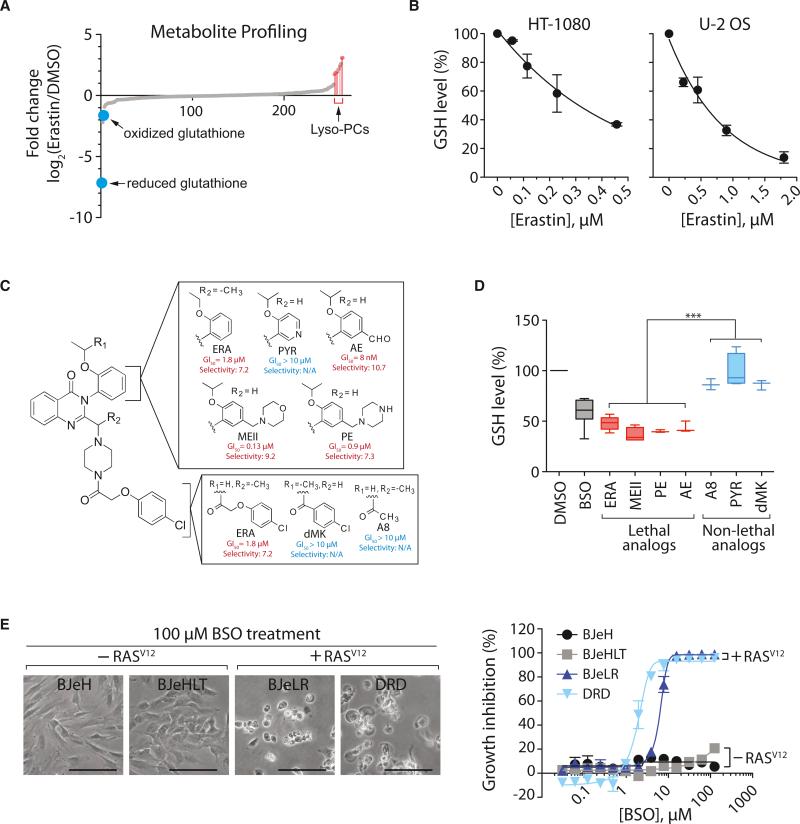
Figure 1. Ferroptosis Involves Generation of Lyso-PC and Depletion of Glutathione.
(A) Changes in metabolites upon erastin treatment.
(B) Dose-dependent depletion of GSH by erastin in HT-1080 cells and U-2 OS cells.
(C) Structure and activity of erastin (ERA) analogs. Potency (GI50; concentration required for 50% growth inhibition) and selectivity (ratio of GI50 in HRAS wild-type cells divided by GI50 in HRAS mutant cells) of each analog are shown. PYR, pyridine erastin; AE, aldehyde erastin; MEII, morpholine erastin II; PE, piperazine erastin.
(D) GSH depletion by erastin analogs. HT-1080 cells were incubated with 10 μM erastin analogs for 5 hr or 100 μM BSO for 12 hr. BSO was used as a positive control for GSH depletion. Data were normalized to the DMSO sample. Box-and-whisker plots (n = 3–8) are as follows: midline represents median, box is the 25th– 75th percentiles, and whiskers are minimum and maximum. ***p < 0.001.
(E) BSO induces selective lethality in BJ-derived tumorigenic cells expressing oncogenic HRAS. Scale bars, 60 μm.
In (B) and (E), data are presented as mean ± SD (n = 3). See also Figure S1 and Table S1.

