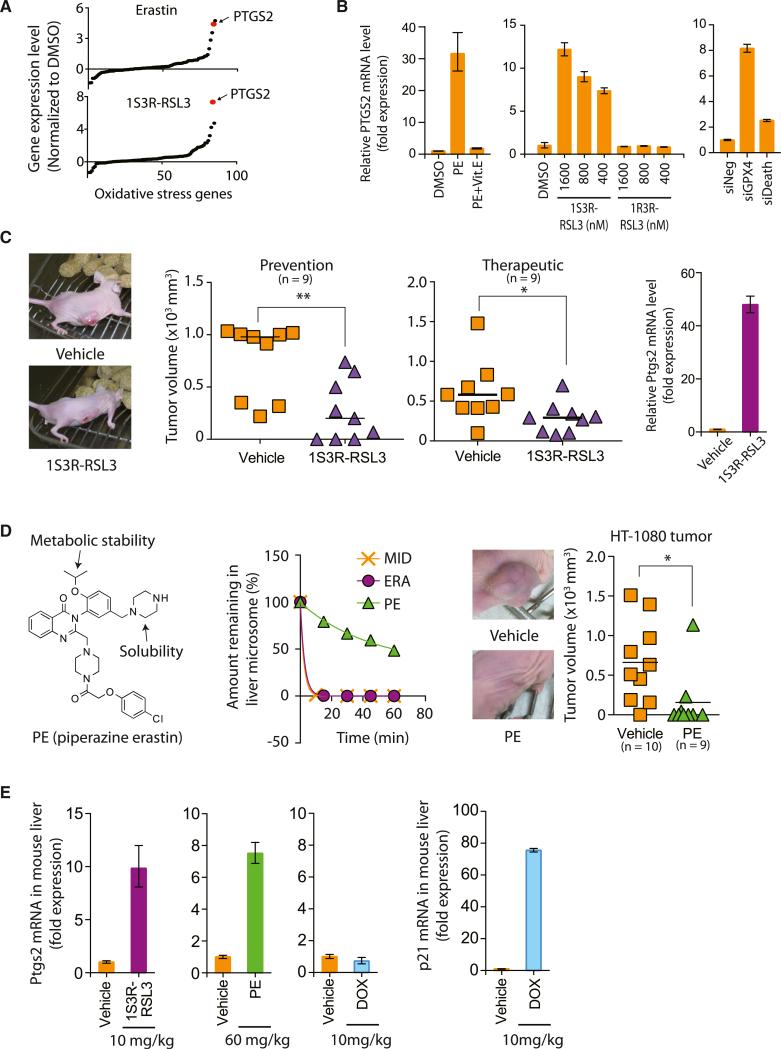
Figure 6. Ferroptosis Suppresses Tumor Growth in a Xenograft Mouse Model.
(A) Upregulation of PTGS2 expression upon erastin and (1S, 3R)-RSL3 treatments.
(B) PTGS2 expression was induced by PE, (1S, 3R)-RSL3, and siGPX4, but not by PE with Vit. E, (1R, 3R)-RSL3, and siDeath.
(C) (1S, 3R)-RSL3 inhibited tumor formation and tumor progression through induction of ferroptosis as demonstrated by upregulation of PTGS2 in the tumors. (1S, 3R)-RSL3 was administered s.c. twice a week for 2 weeks.
(D) PE showed efficacy in preventing HT-1080 tumor formation in a mouse xenograft model. The left view shows the structure of PE. The middle view is a mouse liver microsome assay demonstrating improved metabolic stability of PE over erastin. Midazolam was used as a positive control for metabolic degradation. The right view shows images representative of tumors in live mice from each treatment group. PE was delivered s.c. twice a week for 1 week and then delivered through tail vein injection once every other day for 6 days.
(E) Pharmacodynamics of PE and (1S, 3R)-RSL3 in the mouse liver tissue.
Bar graphs in (B), (C), and (E) represent mean ± SD (n = 3). In (C) and (D), the lines in the tumor volume plots indicate mean of nine data points. *p < 0.05; **p < 0.01. See also Figure S6 and Table S4.

