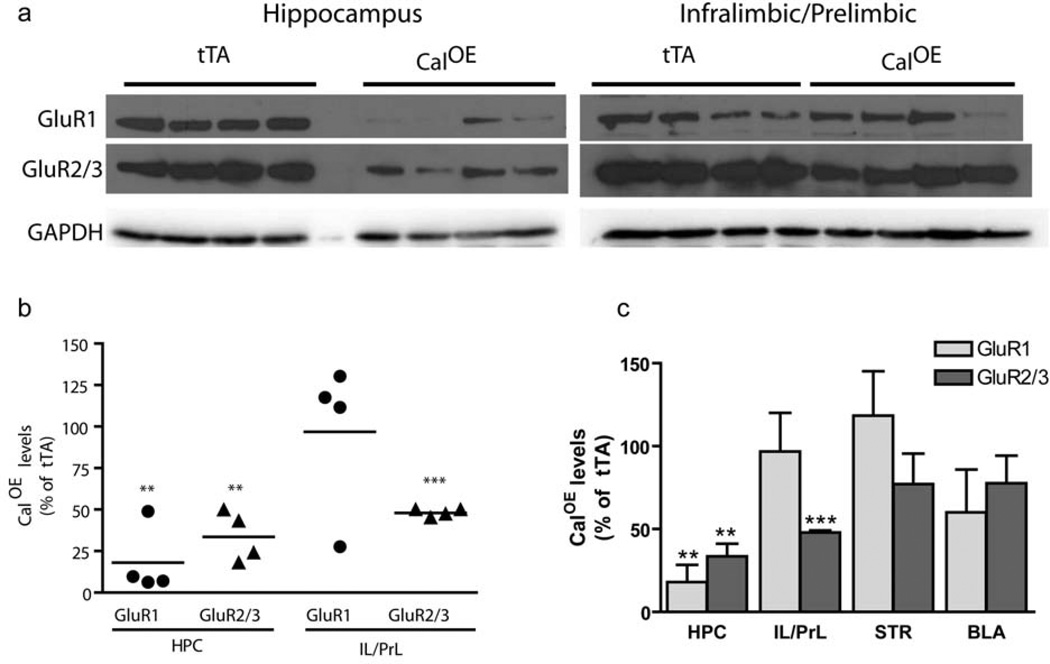
Figure 7. Down-regulation of AMPA subunits in CalOE mice.
(a) Immunoblots of HPC and IL/PrL cortex from CalOE (n=4) and tTA (n=4) mice probed with GluR1, GluR2/3 or GAPDH antibodies as indicated. (b) Scatter plot of GluR1 (circles) and GluR2/3 (triangles) levels in HPC (HPC) and infralimbic and prelimbic (IL/PrL) area in each CalOE mouse normalized to the average value in the tTA group. Line shows the mean; ** and *** , p = and <0.001, respectively. (c) Histogram summarizing the results of all brain areas tested, dorsal striatum (STR) basal lateral amygdala (AMY). Bars and error bars show the mean and SEM of the group data.

