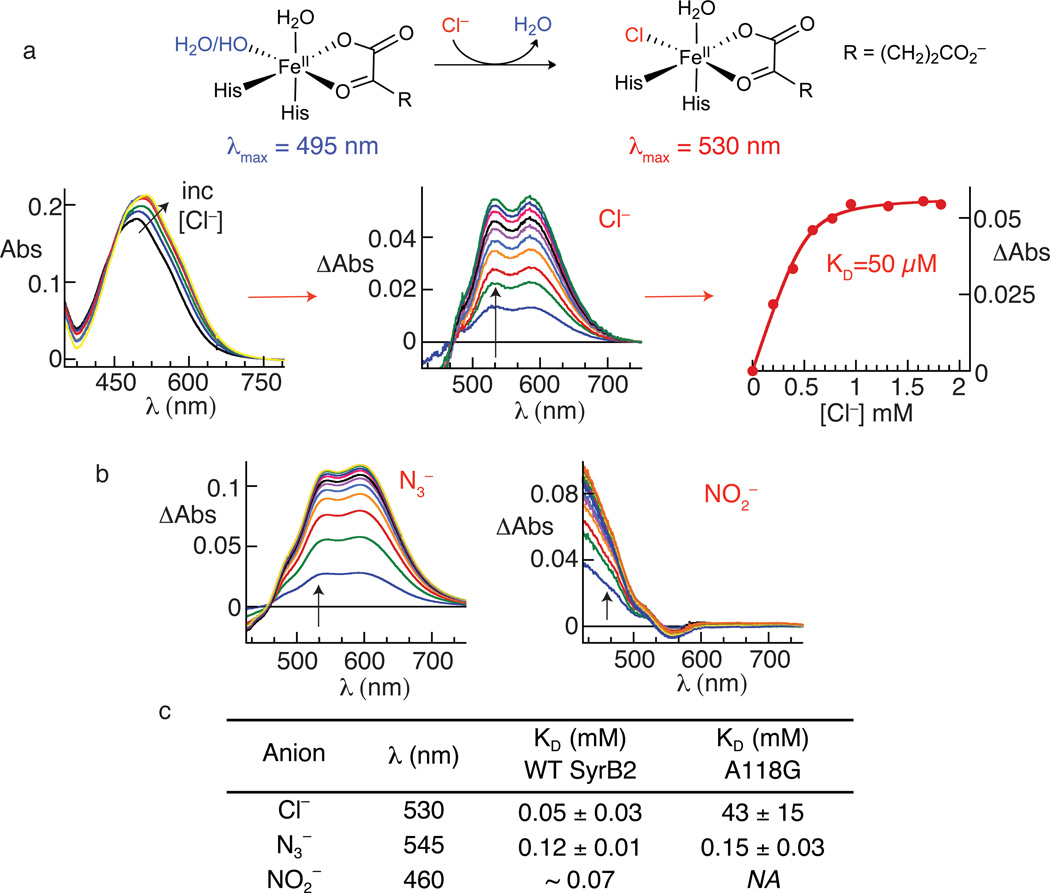
Figure 3. inding of chloride, azide and nitrite to the SyrB2•Fe(II)•αKG complex monitored by perturbations to the absorption spectrum from the FeII→αKG MLCT transition.
Panel a summarizes the basis for the perturbation (top) and the progression in the analysis from experimental spectra (left) to difference spectra (middle) to titration curve (right) for the native Cl−. Spectra were collected after each addition of an aliquot of the concentrated, buffered Cl− solution. For each experimental spectrum, correction was made for dilution by the Cl− solution, the spectrum of the starting solution was subtracted from the dilution-corrected spectrum, and the absorbance at 800 nm was set to zero. Panel b shows the corresponding difference spectra for the titrations with N3− (left) and NO2− (right). Panel c gives the dissociation constants (KD) determined by plotting the change in absorbance (ΔAbs) at an appropriate wavelength (indicated by the arrows in a and b) versus [anion] and fitting the equation for a hyperbolic or quadratic curve to the data, as appropriate. Difference spectra and titration curves used to determine KD values reported in c for the A118G variant are shown in Supplementary Figs. 10 and 11.

