
Figure 2. Running-evoked differential rises in PV-driven GCaMP Ca2+ signal around dPCs and sPCs.
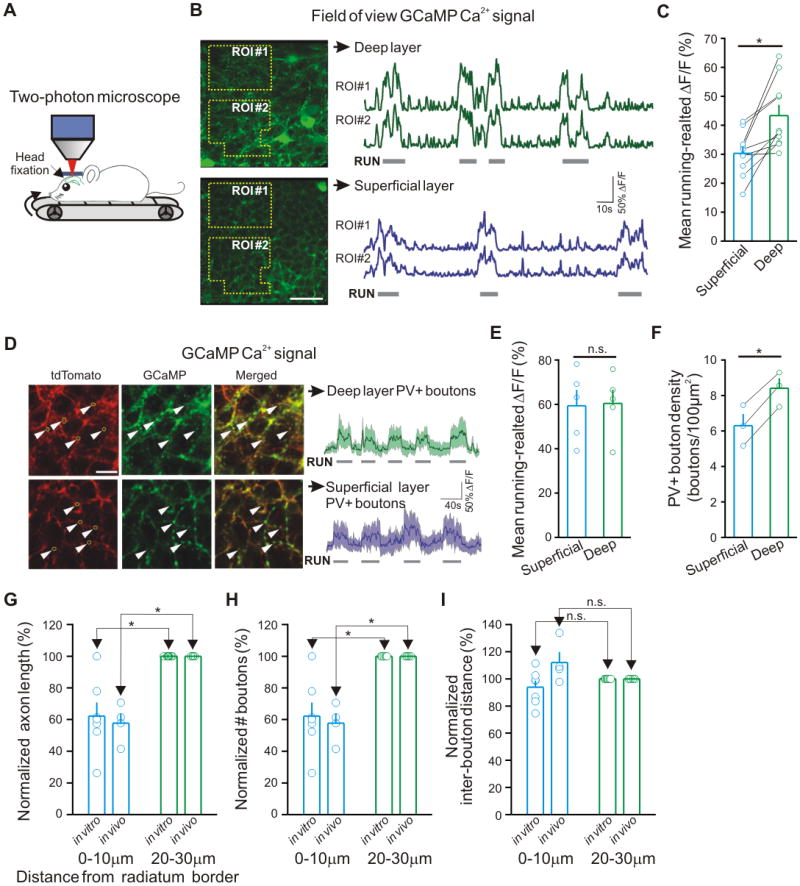
(A) Schematic of in vivo 2-photon imaging experiments. (B) Left: Example time-averaged fluorescence images (2000 frames) from the superficial and deep sublayers of the CA1 stratum pyramidale in the dorsal (septal) CA1. Relative change in GCaMP Ca2+ fluorescence (ΔF/F) was first calculated over 2-4 polygonal regions of interest (ROIs) for superficial and deep imaging planes and then averaged within FOVs. Wide-field ROIs were selected to avoid somatic or dendritic profiles of PV+ interneurons in both imaging planes; scale bar: 40μm. Right: Example ΔF/F traces from the two ROIs in superficial and deep sublayers. Horizontal bars indicate periods of running. (C) Summary of mean relative GCaMP Ca2+ fluorescence change during running activity in FOVs. (D) Left: Example time-averaged fluorescence images from superficial and deep sublayers taken at high magnification (red, tdTomato; green, GCaMP). Bouton ROIs (yellow circles show five examples; arrow heads point to the areas of the circles) were selected based on the stationary tdTomato signal. Scale bar: 10μm. Right: Representative fluorescence traces (all boutons in FOV with a response between 0 and 200% ΔF/F) of GCaMP Ca2+ signals in superficial and deep sublayers. Horizontal bars indicate periods of running activity. (E) Summary of mean running-evoked GCaMP Ca2+ signal in perisomatic PV+ boutons compared across the two sublayers. (F) Summary of bouton density per 100μm2 in the two sublayers. (G, H, I) Summary of morphological measurements of axons of PVBCs filled in vitro and in vivo in the septal CA1. n.s.: not significant (in this and subsequent figures).