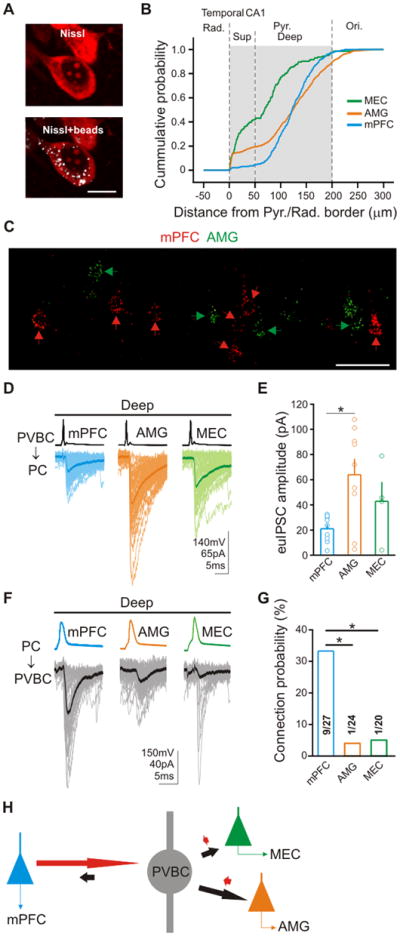
Figure 6. Heterogeneous microcircuits between PVBCs and dPCs with different longdistance axonal projection targets.

(A) Example of a retrogradely labeled PC in Nissl stained material used to generate data in panel B; scale bar: 10μm. (B) Cumulative probability distributions of soma location of dPCs projecting to MEC (green), AMG (orange) or mPFC (blue) from the temporal hippocampus. (C) Confocal image of retrogradely labeled dPCs after ipsilateral double injections of fluorescent microspheres into mPFC (red beads) and AMG (green beads). Green arrows: AMGPCs; red arrows: mPFCPCs; scale bars: 50μm. (D) Representative traces from presynaptic PVBCs (top) and postsynaptic mPFCdPCs, AMGdPCs, or MECdPCs. (E) Summary of euIPSC amplitudes. (F) Representative traces from differentially projecting presynaptic dPCs and postsynaptic PVBCs. (G) Summary of connection probabilities. (H) Schematic representation of data from Figures 6D to 6G; length of red and black arrows is proportional to mean euI/EPSC amplitudes times connection probability).
