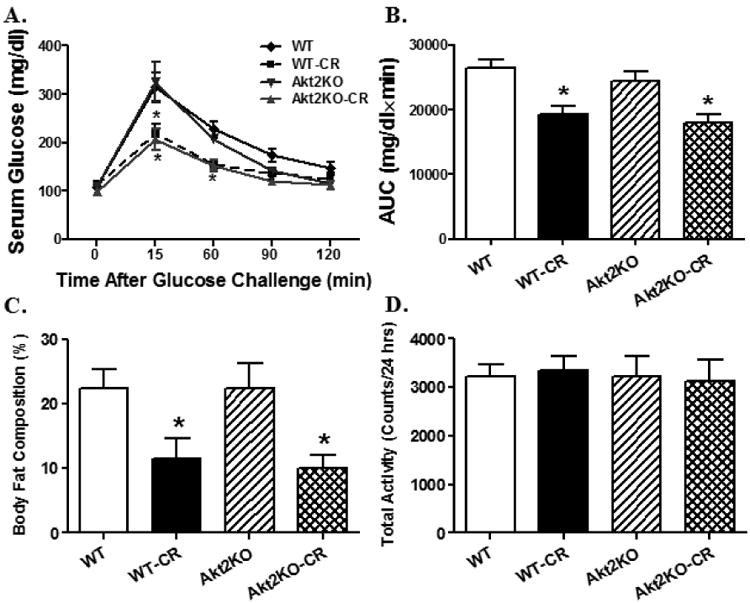
Fig. 1.

Intraperitoneal glucose tolerance test (IPGTT, 2 g/kg body weight), body fat composition and physical activity in control or caloric restricted (CR) WT and Akt2 knockout (KO) mice. A: IPGTT curve depicting glucose clearance capacity; B: Area underneath the curve plotted (AUC) in panel A; C: Body fat composition measured using DEXA; and D: Physical activity measured using an infrared sensor. Mean ± SEM, n = 6-8 mice per group, * p < 0.05 vs. WT group.
