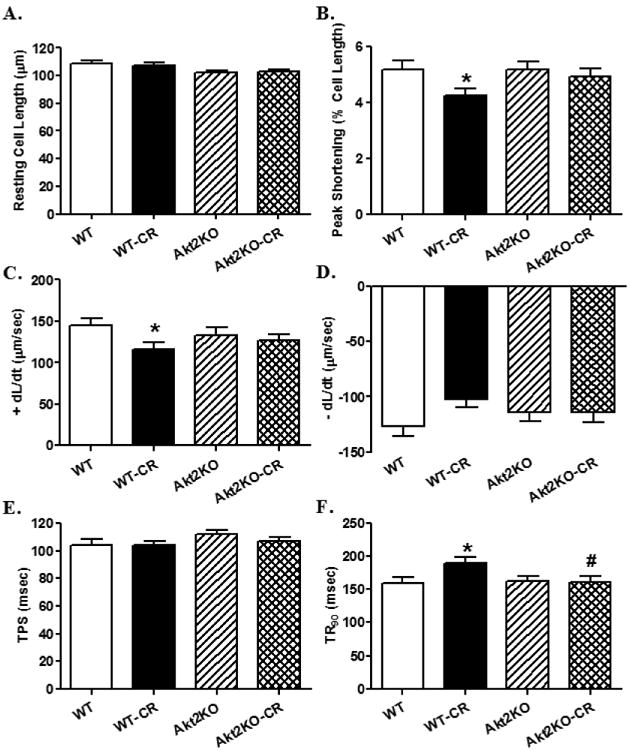
Fig. 2.

Cardiomyocyte contractile function in control or caloric restricted (CR) WT and Akt2 knockout (KO) mice. A: Resting cell length; B: Maximal velocity of shortening (+ dL/dt); C: Maximal velocity of relengthening (– dL/dt); D: Peak shortening (PS, normalized to resting cell length); E: Time-to-PS (TPS); and F: Time-to-90% relengthening (TR90). Mean ± SEM, n = 139 cells from 4 mice per group, *p < 0.05 vs. WT group, #p < 0.05 vs. WT-CR group.
