
Fig. 8.
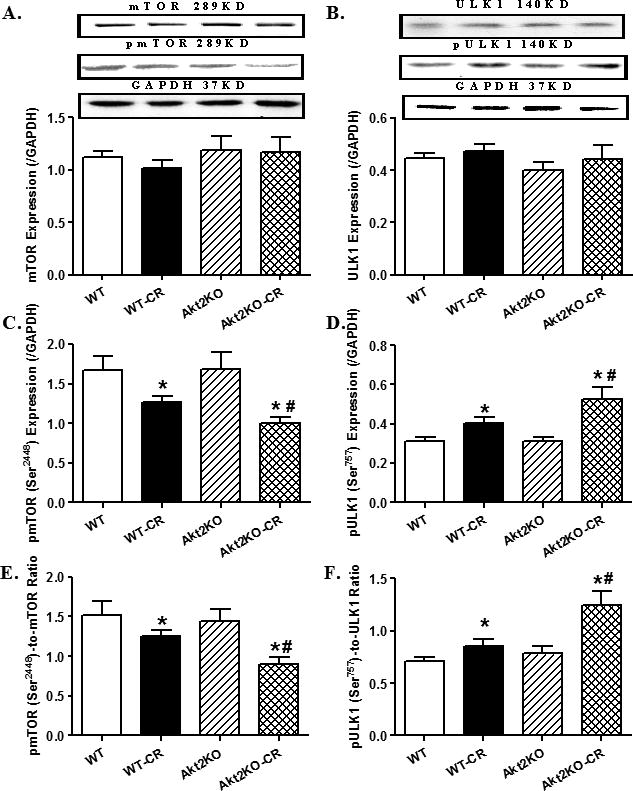
Levels of autophagy regulatory cell signaling molecules mTOR and ULK1 in hearts from control or caloric restricted (CR) WT and Akt2 knockout (KO). A-B: Total expression of mTOR and ULK1; C-D: Phosphorylated form of mTOR and ULK1; and E-F: Ratios of phosphorylated to total forms of mTOR and ULK1. Insets: Representative gel blots depicting total and phosphorylated levels of mTOR and ULK1. GAPDH was used as the loading control. Mean ± SEM, n = 6 – 7 mice per group, *p < 0.05 vs. WT group, #p < 0.05 vs. WT-CR group.