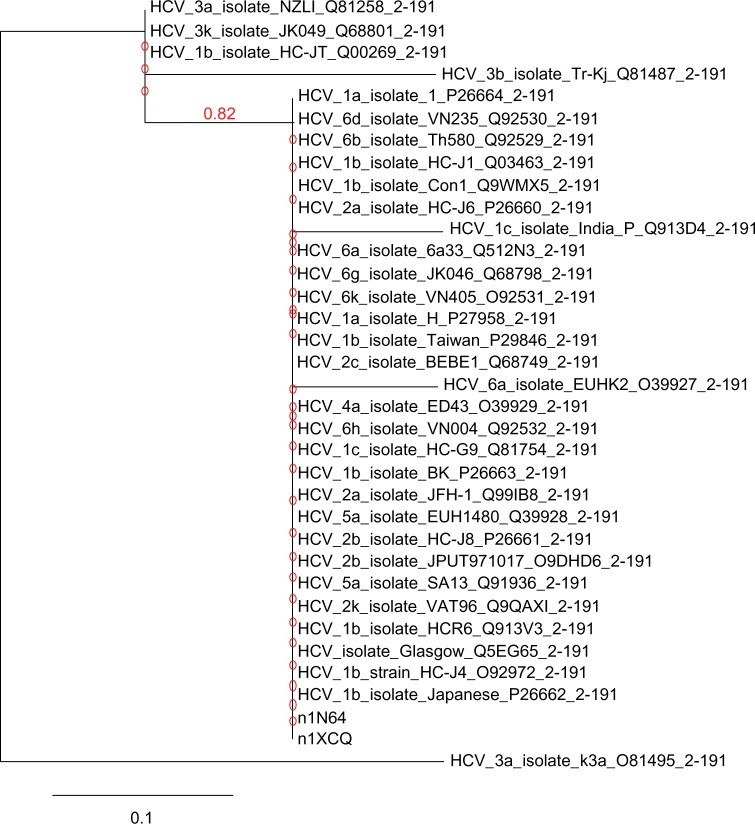
Figure 3.
Phylogram chart of capsid core proteins in HCV genotypes. Tree represents strong correlation among both template and subtypes of different HCV genotypes capsid protein sequence as their branch length leading to these nodes is very close. The unit change in AA sequence among the species is 0.1%.

