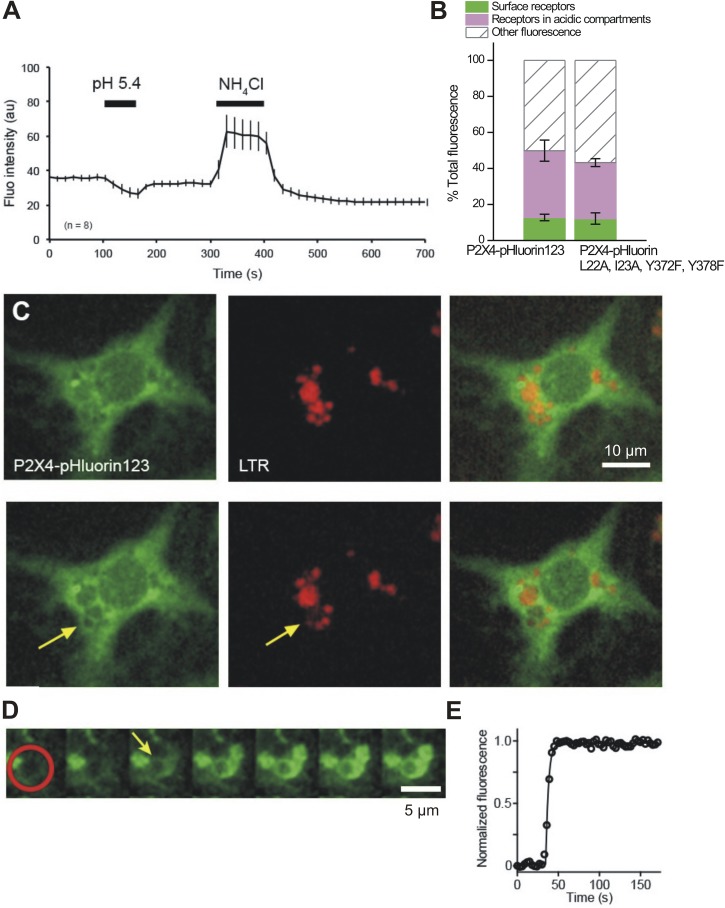
Figure 11.
Distribution of P2X4-pHluorin123 receptors in primary ATII cells. (A) Graph illustrating how average fluorescence of primary ATII cells expressing P2X4-pHluorin changes under the indicated conditions. (B) Summary data showing the proportions of P2X4-pHluorin receptors in cellular compartments of ATII cells expressing either WT P2X4-pHluorin or P2X4-pHluorin carrying quadruple mutations that block lysosomal targeting and endocytosis. (C) Simultaneous imaging of P2X4-pHluorin123 (green) and LTR (red) before (top row) and after (bottom images) exocytic fusion of an LB with the PM. Arrow indicates fused LB, revealed by a decrease in vesicular LTR fluorescence caused by diffusion of LTR from the vesicle lumen. (D) Time-lapse image series of an increase in P2X4-pHluorin123 fluorescence on the membrane of an LB after fusion caused by the increase in luminal pH of the fused LB. The red circle indicates the region where the increase in P2X4-pHluorin123 fluorescence was measured after fusion of LB with the PM. Images were acquired at 0.3 Hz; the arrow indicates time of fusion. (E) Time course of P2X4-pHluorin123 fluorescence within the area of the red circle in D. Error bars represent mean ± SEM.

