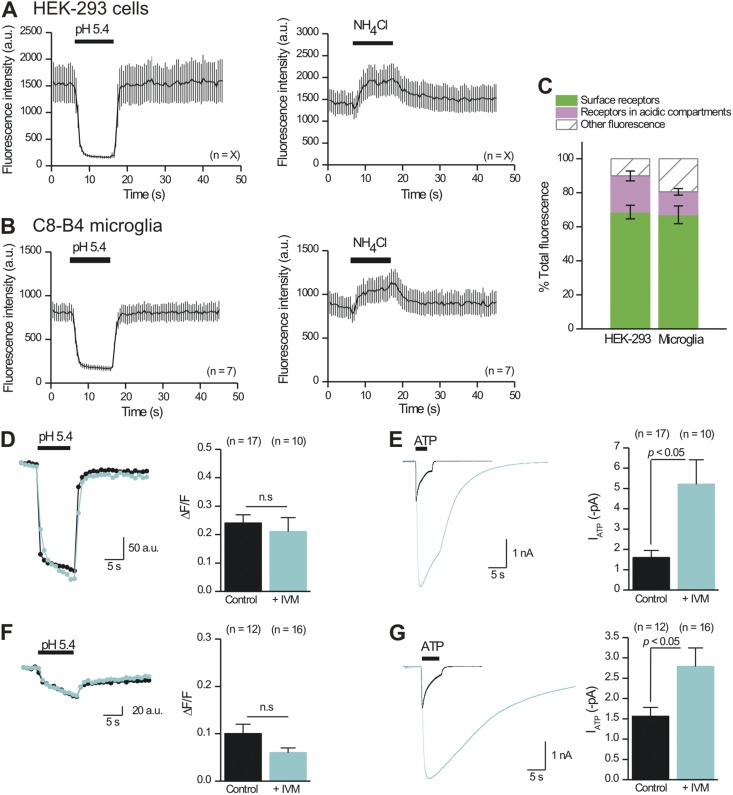
Figure 12.
IVM does not detectably increase the cell surface fraction of P2X4-pHluorin123 receptors in HEK-293 cells or C8-B4 microglia. (A) The graphs plot the effect of acidic and alkalinizing solutions on the intensity of P2X4-pHluorin123 receptors expressed in HEK-293 cells and studied by TIRF microscopy, which reports only on receptors within ∼100 nm of the PM. (B) As in A, but for P2X4-pHluorin123 receptors expressed in C8-B4 microglial cells. (C) Summary data for the fraction of P2X4-pHluorin123 receptors on the cell surface and within acidic compartments located within ∼100 nm of the PM for HEK-293 cells and C8-B4 microglia. Only cell bodies were imaged reliably with TIRF, likely because the interactions between processes and glass were minimal. (D) Representative traces and average data for the acid-quenched component of P2X4-pHluorin123 receptors in HEK-293 cells before and during 3-µM IVM applications. (E) Representative traces and average data for 100-µM ATP-evoked currents mediated by P2X4-pHluorin123 receptors in HEK-293 cells before and during 3-µM IVM applications. (F and G) As in D and E, but for P2X4-pHluorin123 receptors expressed in C8-B4 microglia. Error bars represent mean ± SEM.

