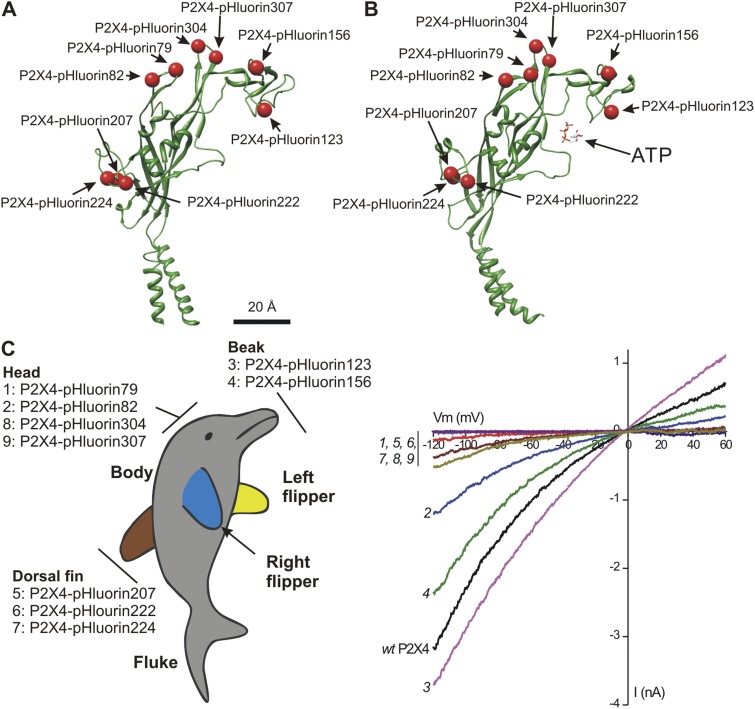
Figure 2.
Anatomy of P2X4-pHluorin receptors and initial screening. (A) The cartoon shows a single P2X4 subunit with the insertion sites for pHluorin indicated as red balls. (B) As in A, but for a P2X4 subunit bound to ATP. (C) The sites for pHluorin insertion mapped onto a dolphin model of a P2X4 subunit. Hence, the constructs we made map to the beak, head, and dorsal fin domains. The graph shows leak-subtracted current–voltage relations for 100 µM of ATP-activated whole-cell currents from HEK-293 cells. The numbers next to each trace correspond to the individual pHluorin constructs, as shown in the dolphin model on the left. From this initial screen, it was apparent that P2X4-pHluorin123 was most similar to WT P2X4. The average data for experiments such as these are shown in Table 1.

