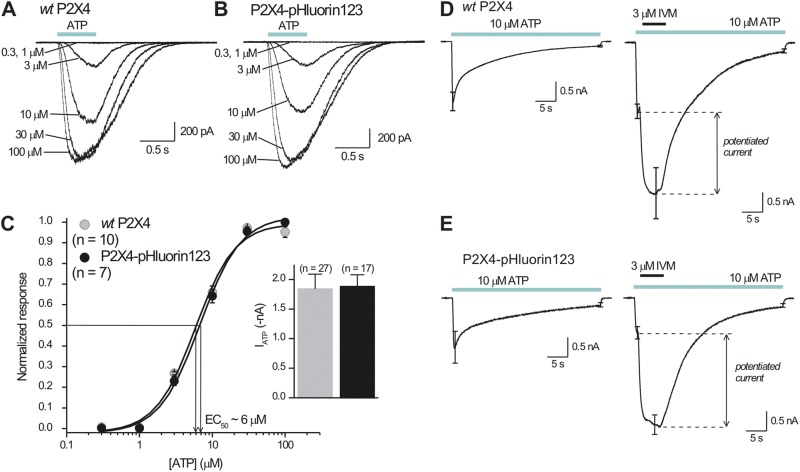
Figure 4.
Functional properties of P2X4-pHluorin123 receptors expressed in HEK-293 cells. (A and B) Representative traces for concentration-dependent ATP-evoked currents for WT P2X4 and P2X4-pHluorin123 receptors expressed in HEK-293 cells. Note the close similarities in the waveforms. (C) Average concentration–effect curves for ATP-evoked currents for WT P2X4 and P2X4-pHluorin123. The inset graph shows the peak 100-µM ATP-evoked currents from multiple cells gathered over a 3-mo period. The graphs for WT P2X4 and P2X4-pHluorin123 were identical, with the receptors displaying similar EC50 values, Hill slopes, and peak currents. (D and E) Current waveforms for WT P2X4 and P2X4-pHluorin123 to assess the extent of desensitization during ∼30-s, 10-µM ATP applications to assess the degree of current potentiation during applications of 3 µM IVM. The data for WT P2X4 and P2X4-pHluorin123 were indiscernible (n = 6 for WT P2X4 and n = 6 for P2X4-pHluorin123). Error bars represent mean ± SEM.

