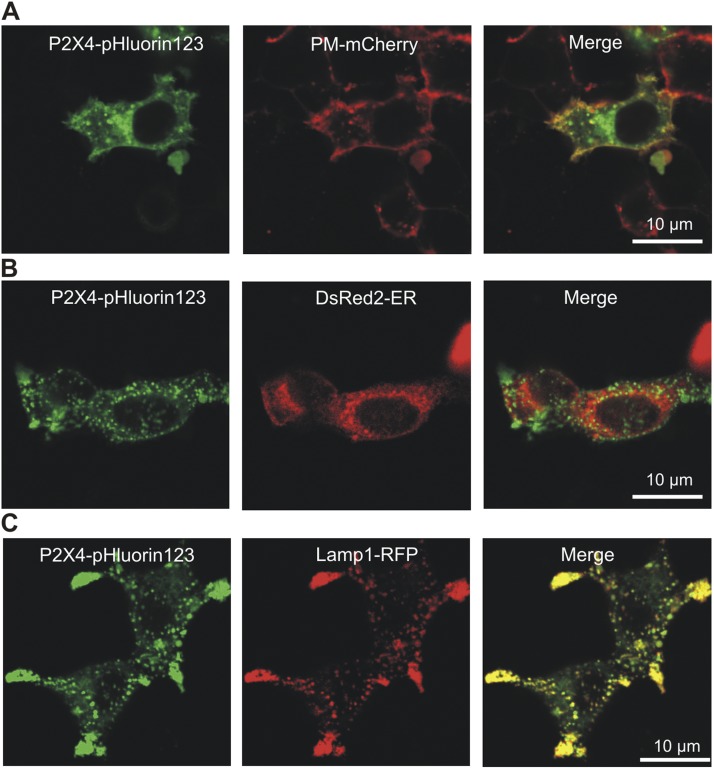
Figure 7.
Cellular distribution of P2X4-pHluorin123 receptors in HEK-293 cells. (A) Representative images of HEK-293 cells expressing P2X4-pHluorin123 (green) and PM-mCherry. (B and C) As in A, but for P2X4-pHlurin and DsRed2-ER (B), and P2X4-pHluorin123 and Lamp1-RFP (C). Average data for Pearson’s correlation coefficients are shown in the Results.

