Figure 8.
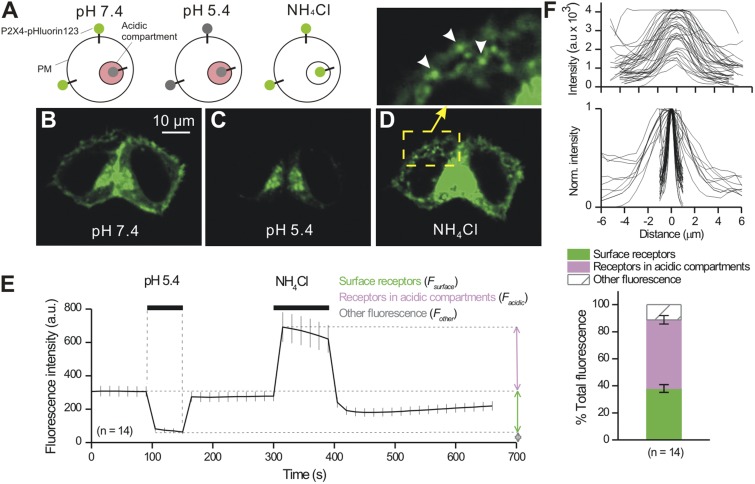
Evaluation of total, surface, and intracellular fractions of P2X4-pHluorin123 receptors in HEK-293 cells. (A) The schematic shows P2X4-pHluorin123 receptors expressed on the PM and within vesicles. The P2X4-pHluorin123 receptors were fluorescent in neutral environments, quenched in the acidic compartments of intracellular vesicles, and unquenched in all compartments when the cells were bathed in NH4Cl. (B–D) Representative images of HEK-293 cells shown under the indicated conditions. Note, as shown in the cartoon in A, that the fluorescence intensity was quenched in acidic buffers and increased in NH4Cl. The inset shows a zoomed-in version of the cell in NH4Cl. Under this condition, numerous vesicles became visible. (E) Average graph showing how the fluorescence of HEK-293 cells expressing P2X4-pHluorin123 changes under the indicated conditions. (F) The top two panels show the FWHM of vesicles that became visible in the presence of NH4Cl. The graphs reveal a range of vesicle sizes (FWHM) and intensities, perhaps representing different loads of P2X4-pHluorin123. The bottom bar graph shows the proportion of P2X4-pHluorin123 receptors on the cell surface, within intracellular compartments, and within other compartments of HEK-293 cells. To generate this graph, the data were analyzed as described in Materials and methods using data from experiments such as those shown in E. Error bars represent mean ± SEM.

