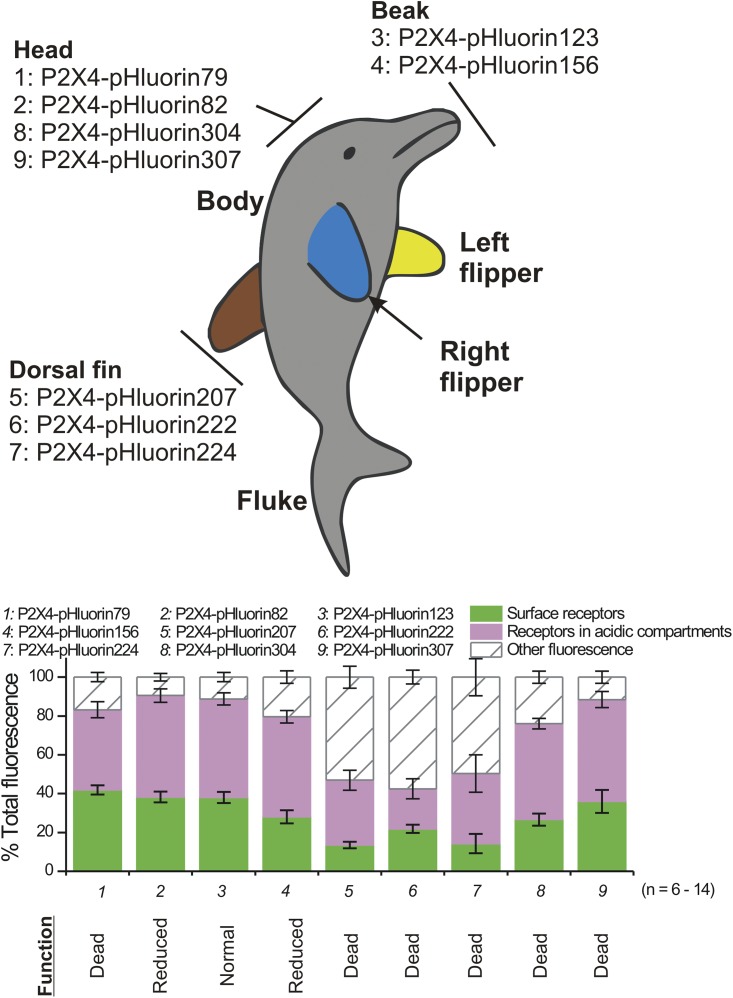
Figure 9.
Summary data for all pHluorin-tagged P2X4 receptors. The top panel represents a dolphin model of P2X4 receptors with the locations of the pHluorin insertion sites shown. The bottom bar graph shows data for each of these constructs and reports the fraction of the total receptors on the cell surface and within intracellular compartments. The data for P2X4-pHluorin123 in this graph are replotted from Fig. 8 for comparison. Of the indicated constructs, only P2X4-pHluorin123 and P2X4-pHluorin79 are interesting because both of these show the same overall distribution in the cells, but P2X4-pHluorin79 is nonfunctional, whereas P2X4-pHluorin123 receptors function like WT P2X4. Error bars represent mean ± SEM.

