Figure 1.
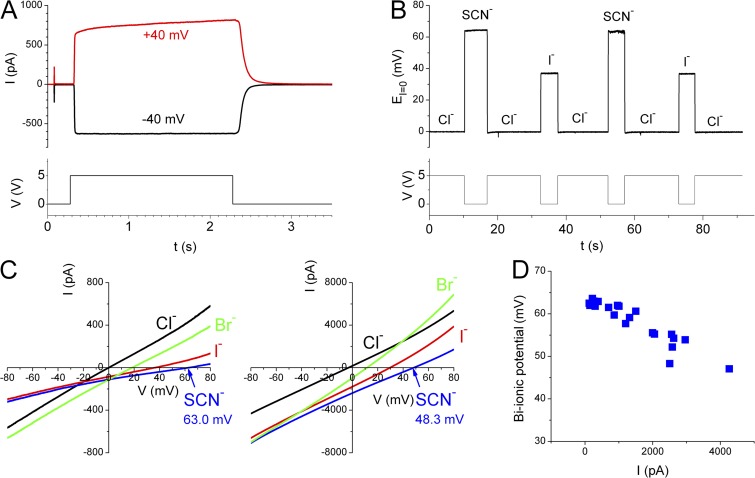
Measuring bi-ionic potential of the TMEM16A current. (A) Activation of Cl− current (top) in an excised inside-out patch expressing TMEM16A in symmetrical 140 mM [Cl−]. (Bottom) The digital signal used to switch between the solutions containing zero-Ca2+ and 20 µM of free [Ca2+]. (B) Current-clamp (I = 0) recordings to monitor the change of bi-ionic potentials upon the switch of anion solutions on the intracellular side. Intracellular solutions contained 20 µM of free [Ca2+] throughout the recording. Same patch as in A. (Bottom) The digital signal for triggering solution exchange. (C) Bi-ionic potentials measured by voltage-clamp recordings. The two panels were recordings from two different patches consisting of currents of different amplitudes (see the scale of the y axis). Different values of Erev were obtained as exemplified in the bi-ionic condition of SCN−/Cl−. (D) The SCN−/Cl− bi-ionic potential as a function of the current amplitude at 40 mV in symmetrical 140 mM Cl−. Each data point was from an independent patch measured either by the voltage-clamp or by the current-clamp recording.

