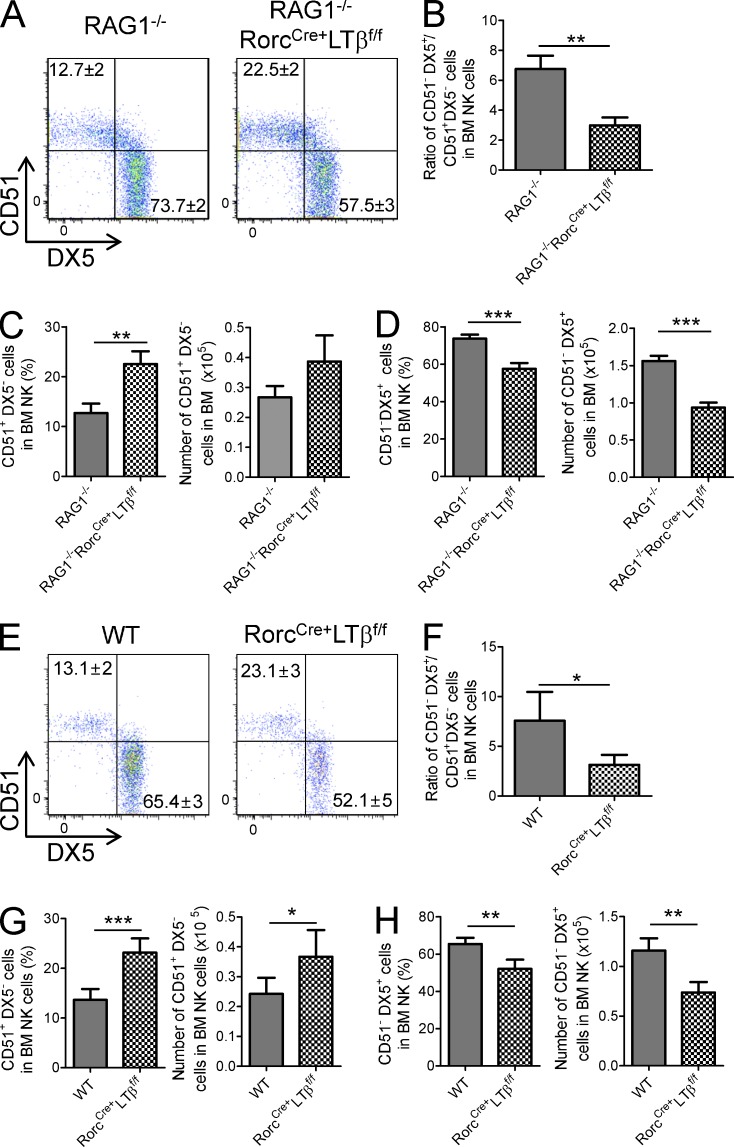
Figure 5.
Absence of LT on RORγt+ ILCs leads to accumulation of the CD51+DX5− iNK cell population. (A) Dot plots indicate the percentage of iNK (CD51+, DX5−) and mNK (CD51−, DX5+) cell populations in BM of RAG1−/− or RAG1−/−RorcCre+LTβf/f mice. (B) Bar graph indicates ratio of iNK (CD51+, DX5−) to mNK (CD51−, DX5+) cells in the indicated mouse strains (each group, n = 10). (C and D) Bar graphs represent the mean percentage ± SEM of frequency or cell number of iNK (CD51+, DX5−) and mNK (CD51−, DX5+) cells. (E) Dot plot indicates the percentage of iNK (CD51+, DX5−) and mNK (CD51−, DX5+) cells in BM of the indicated mouse strains on the B6 background. (F) Bar graph indicates the ratio of iNK (CD51+, DX5−) to mNK (CD51−, DX5+) cells in the indicated mouse strains on the B6 background (each group, n = 9). (G and H) Bar graphs represent percentage and cell number of iNK (CD51+, DX5−) and mNK (CD51−, DX5+) cells. Data are from at least nine independent experiments. All data are presented as the mean ± SEM. *, P < 0.05; **, P < 0.01; ***, P < 0.001.

