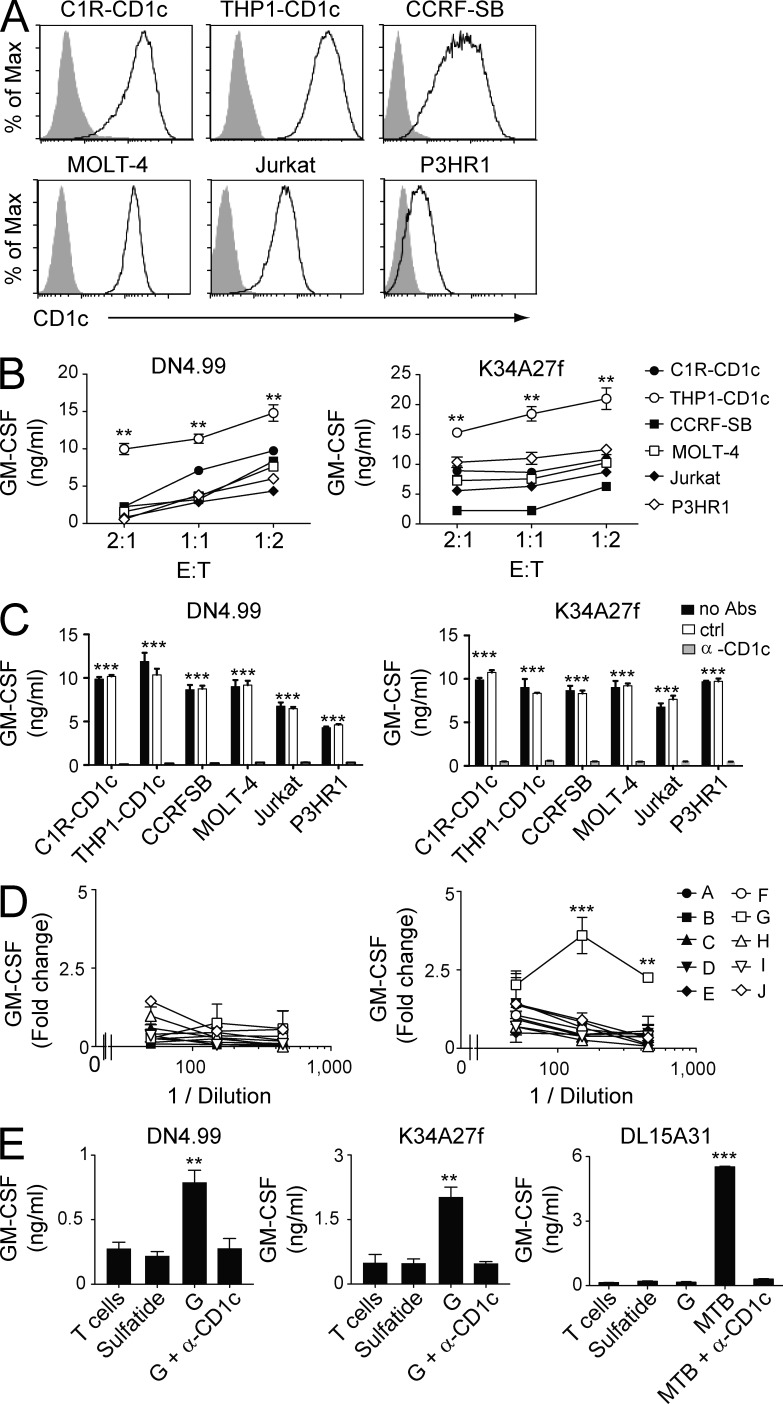
Figure 1.
Recognition of leukemia cell lines and leukemia-derived lipids by CD1c autoreactive T cells. (A) Flow cytometry detection of CD1c surface protein in C1R and THP1 cell lines transfected with CD1c cDNA and other leukemia cell lines constitutively expressing CD1c. Gray histograms represent staining with isotype-matched control mAbs. (B) Recognition of CD1c-expressing leukemia cell lines by CD1c self-reactive T cell clones DN4.99 (left) and K34A27f (right) at the indicated E/T ratios. T cell activation was assessed by measurements of GM-CSF release. (C) Anti-CD1c blocking mAbs (α-CD1c) inhibit the recognition of CD1c-expressing leukemia cell lines by DN4.99 (left) and K34A27f (right). T cell reactivity in the absence of antibodies (no Abs) and presence of matched isotype control mAbs (ctrl) is shown. T cell activation was evaluated my measuring GM-CSF release. (D) Fractions (A–J) of THP1 lipids extracted from the organic (left) and aqueous phase (right) were used to stimulate DN4.99 T cells in the presence of fixed THP1-CD1c cells. T cell activation was assessed by measurement of GM-CSF release and expressed as fold change over background. (E) CD1c self-reactive T cell clones DN4.99 (left) and K34A27f (middle) or CD1c-restricted M. tuberculosis–specific DL15A31 T cells (right) were cultured either alone (T cells) or in the presence of plastic-bound sCD1c molecules loaded with sulfatide, fraction G from aqueous extraction (G), or M. tuberculosis sonicate (MTB) with or without anti-CD1c blocking mAbs (α-CD1c). T cell activation was assessed by measurement of GM-CSF release. All data are represented as mean ± SD. Results are representative of three (B, C, and E) and seven (D) independent experiments. **, P < 0.01; ***, P < 0.001, determined by two-tailed Student’s t test. P-values in C refer to both groups “no Abs” and “ctrl” individually compared with the group “α-CD1c.”

