Figure 2.
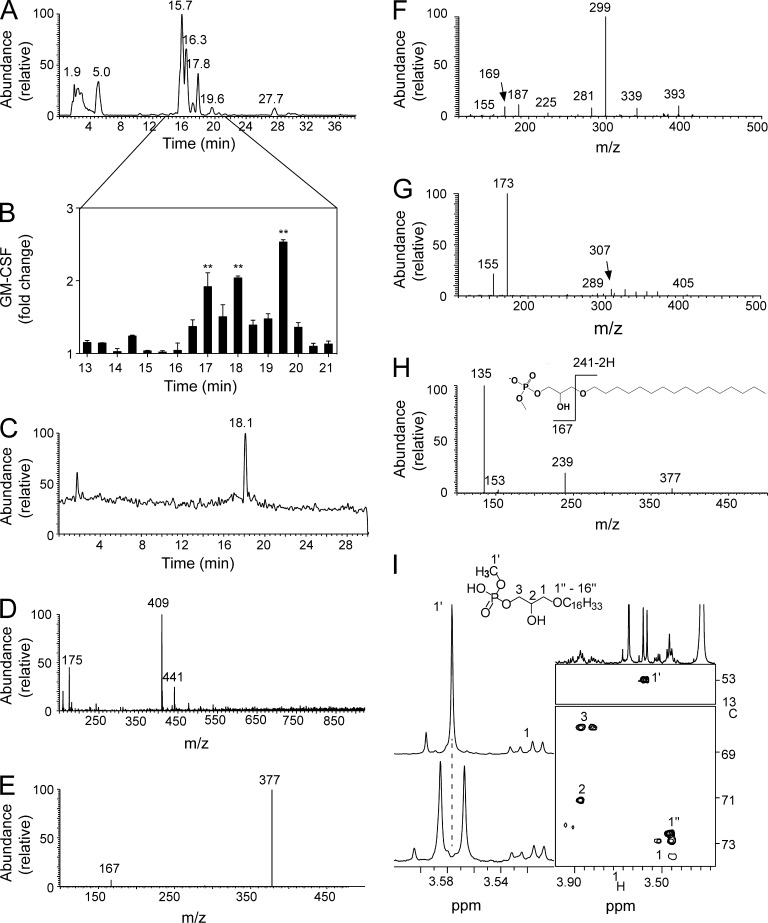
Identification of mLPA as a CD1c-restricted T cell antigen. (A) LC-MS total ion profile of fraction G derived from aqueous extract. (B) Activation of DN4.99 T cells by fixed THP1-CD1c cells in the presence of HPLC-MS lipid subfractions (minutes 13–21) derived from fraction G. GM-CSF levels are expressed as fold change over background. Error bars represent SD. **, P < 0.01, determined by two-tailed Student’s t test. Data are representative of three independent experiments. (C) Profile of LC-MS rechromatography of the active subfraction collected at 17 min. (D) Mass spectrum of the compound eluted at 18.1 min, showing a single molecular species with m/z 409 in negative ion mode. (E) MS2 spectrum of ion m/z 409. (F) MS2 spectrum of ion m/z 411 from fraction G as analyzed in positive mode. The presence of a methylated phosphate head group was confirmed by the detection of a major peak at m/z 299 (caused by the loss of 112 D from parent ion m/z 411) and presence of ions at m/z 187 and 169. A low intensity ion at m/z 225 was attributable to a hexadecyl-carbocation, which supported the existence of a C16 alkyl chain (as predicted by the negative mode analysis). (G) MS2 spectrum of the unmodified LPA 1-O-9-(Z)-octadecenyl-sn-glycero-3-phosphate. The spectrum showed signature ions for a phosphate head at m/z 155 and 173. These ions were shifted to m/z 169 and 187 in the spectrum presented in F because of the presence of an additional methyl group in the polar head. (H) MS3 spectrum of ion m/z 377 and structure and fragmentation pattern of C16 mLPA. (I) Part of the 1H-NMR profile of the fraction collected at 17 min either without (bottom) or with (top) broadband decoupling on the 31P channel. Sections of the 13C-1H HSQC spectrum showing the relevant cross peaks for the assignment of mLPA (right).

