Figure 5.
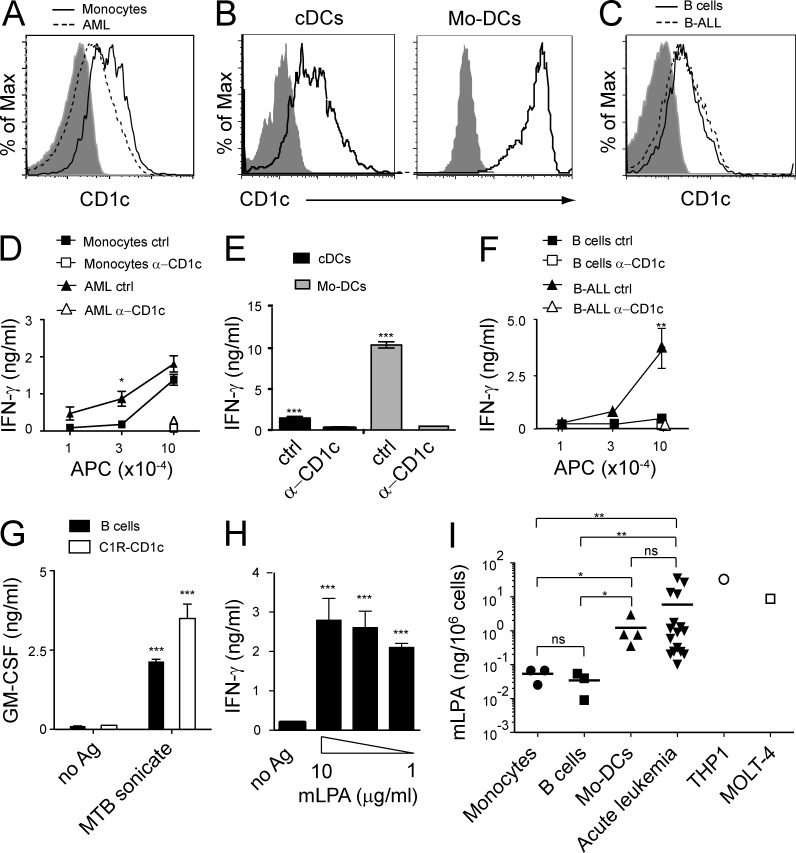
Differential recognition of malignant and healthy hematopoietic cells by mLPA-reactive T cells. (A–C) Expression of CD1c by healthy donor-derived primary monocytes and primary AML blasts (A), primary DCs purified from circulating mononuclear cells (cDCs) and Mo-DCs (B), and B cells from healthy donors and primary B-ALL blasts (C). (D–F) The same cell types were used to stimulate DN4.99 T cells in the presence of anti-CD1c mAbs (α-CD1c) or isotype-matched control mAbs (ctrl). IFN-γ release by T cells was measured and expressed as mean ± SD. (G) Normal B cells efficiently presented M. tuberculosis lipid antigen (MTB sonicate) to CD1c-restricted M. tuberculosis–specific T cells (DL15A31). C1R-CD1c lymphoblastoid cells were used as control. T cell activation was assessed by measuring release of GM-CSF, expressed as mean ± SD. (H) Normal B cells efficiently presented C16 mLPA to CD1c self-reactive T cells (DN4.99). T cell activation was evaluated by measuring release of IFN-γ, expressed as mean ± SD. (A–H) Results are representative of three (A–G) and four (H) independent experiments. *, P < 0.05; **, P < 0.01; ***, P < 0.001, two-tailed Student’s t test. (I) C16 mLPA content in normal primary circulating monocytes (n = 3) and B cells from healthy donors (n = 3), in vitro–differentiated Mo-DCs (n = 4), primary circulating B-ALL and AML blasts (acute leukemia, n = 5 and n = 11, respectively), AML cell line THP1, and T-ALL cell line MOLT-4. In primary acute leukemia samples the percentage of blasts ranged between 75 and 97%. The mLPA concentration value of each sample represents the mean value of two to three independent determinations performed with the same sample. Horizontal bars represent the mean values of the primary samples. *, P < 0.05; **, P < 0.01; ns, not statistically different, two-tailed Student’s t test.

