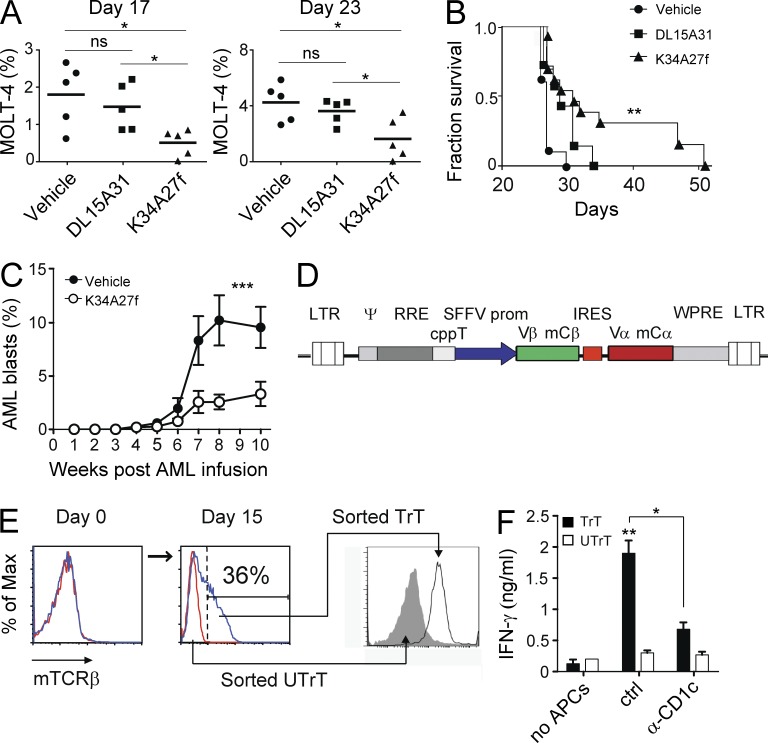
Figure 7.
mLPA-specific T cells are promising tools for T cell adoptive immunotherapy of CD1c+ acute leukemia. (A) Percentage of circulating MOLT-4 cells at different time points in mice inoculated with CD1c-restricted T cell clones specific for mLPA (K34A27f) or M. tuberculosis (DL15A31) or with saline only (vehicle). Horizontal bars represent the mean values. *, P < 0.05; ns, not significant, two-tailed Student’s t test. (B) Survival of mice that received either T cells or vehicle alone. Data show cumulative results from three independent experiments including five mice per group. Mice that received mLPA-specific T cells showed increased survival. **, P < 0.01, Mantel-Cox test. (C) Progression of human primary CD1c+ AML blasts in NSG mice that received mLPA-specific K34A27f T cells (n = 5) or vehicle only (n = 5). The percentage of AML blasts was monitored by flow cytometry in PBMCs at the indicated times. Bars indicate mean ± SD. Results are representative of two independent experiments. ***, P < 0.001, nonparametric Student’s t test. (D) Map of the bicistronic lentivirus vector pHR-SINEGFP carrying the chimeric TCR V-(D)-J segments from the mLPA-specific T cell clone DN4.99, fused with the mouse TCR Cα or Cβ cDNAs. Both chains are expressed from the internal spleen focus forming virus (SSFV) promoter. (E) Generation of mLPA-specific T cell lines in vitro upon transduction of polyclonal T cells with the lentivirus described in D. TCR expression by transduced (TrT, blue lines) and untransduced (UTrT, red lines) T cells at days 0 and 15 and after sorting. TCR expression was detected using mouse Cβ-specific (mTCRβ) mAbs. Data are representative of three experiments. (F) Recognition C1R-CD1c lymphoblastoid cells by T cells transduced with the DN4.99 TCR (TrT) but not by untransduced ones (UTrT). T cells were cultured without (no APCs) or with C1R-CD1c cells in the presence (α-CD1c) or absence (ctrl) of anti-CD1c blocking mAbs. Bars indicate mean ± SD of IFN-γ production of triplicate cultures. Results are representative of three experiments. *, P < 0.05; **, P < 0.01; ns, not statistically different, two-tailed Student’s t test.

