Figure 3.
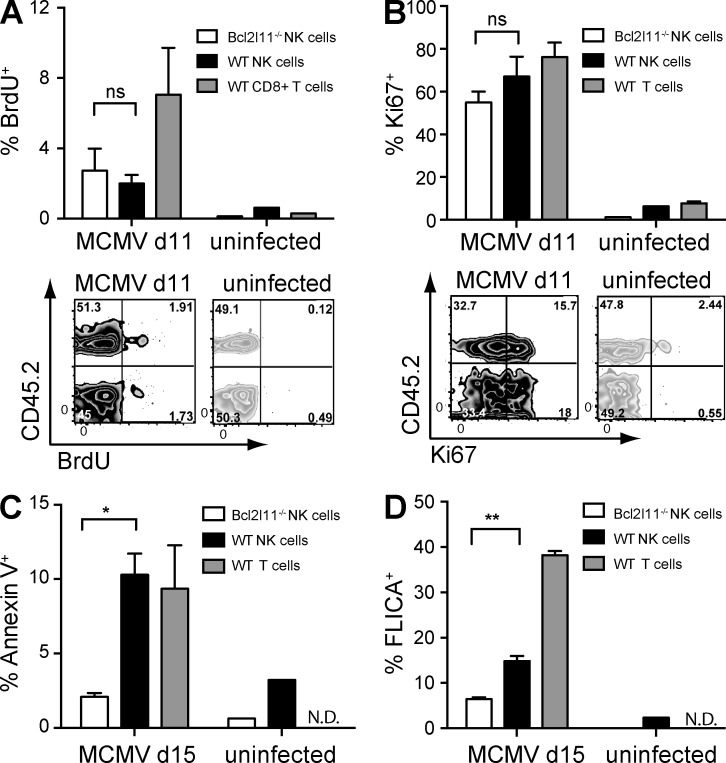
Impaired contraction in Bcl2l11−/− NK cells reflects decreased apoptosis. (A) The percentages of adoptively transferred Bcl2l11−/− or WT BrdU+NK1.1+TCRβ−Ly49H+ NK cells or BrdU+TCRβ+CD8+ T cells are plotted for infected and uninfected mice at day 11 after MCMV, after a 2-h in vivo pulse of BrdU. Representative flow cytometry plots are shown for CD45.2+ (Bcl2l11−/−) and CD45.2− (WT) cells (n = 3 mice per time point). (B) The percentages of Ki67+NK1.1+TCRβ−Ly49H+ NK cells or Ki67+TCRβ+ T cells are shown for infected and uninfected mice at day 11. Representative flow cytometry plots are shown for CD45.2+ (Bcl2l11−/−) and CD45.2− (WT) cells. (C and D) The percentage of annexin V+ (C) and FLICA+ (D) NK1.1+TCRβ−Ly49H+ NK cells is shown for the Bcl2l11−/− and WT NK cell subsets in infected and uninfected mice at day 15 after MCMV. TCRβ+ T cells are shown as a control (n = 3 mice per group). Data in each panel are representative of two to three independent experiments. Error bars signify the standard error of the mean. **, P < 0.01; *, P < 0.05.

