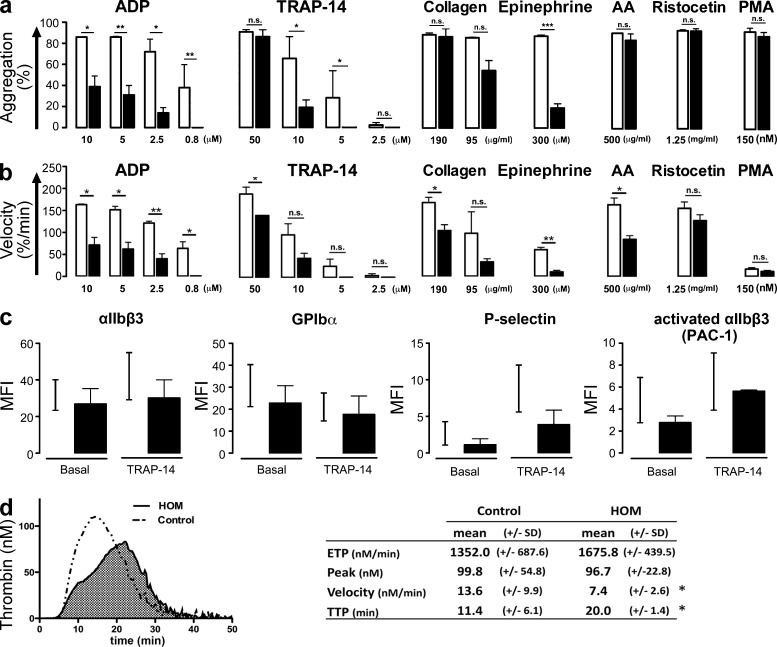
Figure 1.
Characterization of the patients’ platelet function. (a) Platelet maximal aggregation (%) and (b) velocity (%/min) from 2 patients (filled bars) and 3 healthy volunteers (open bars) induced by ADP, TRAP-14, collagen, epinephrine, arachidonic acid, ristocetin, and PMA tested on 5 different occasions (Student’s t test; *, P < 0.05; **, P < 0.01; ***, P < 0.001). (c) Levels of αIIbβ3 integrin, GPIbα, P-selectin, and PAC-1 binding (activated αIIbβ3) on resting and TRAP-14 (50 µM)-stimulated platelets from 2 patients measured by flow cytometry and expressed as mean fluorescence intensity (MFI). Black lines represent the range between minimum and maximum MFI obtained from healthy volunteers (n = 8). (d) Endogenous thrombin generation in PRP (left) and representative thrombograms (right). Thrombogram parameters: area-under-the-curve or ETP (total thrombin activity during coagulation); peak height (maximal rate of thrombin formation); reaction velocity and time to thrombin peak (n = 5 for controls; n = 2 for HOM; Student’s t test, *, P < 0.05).

