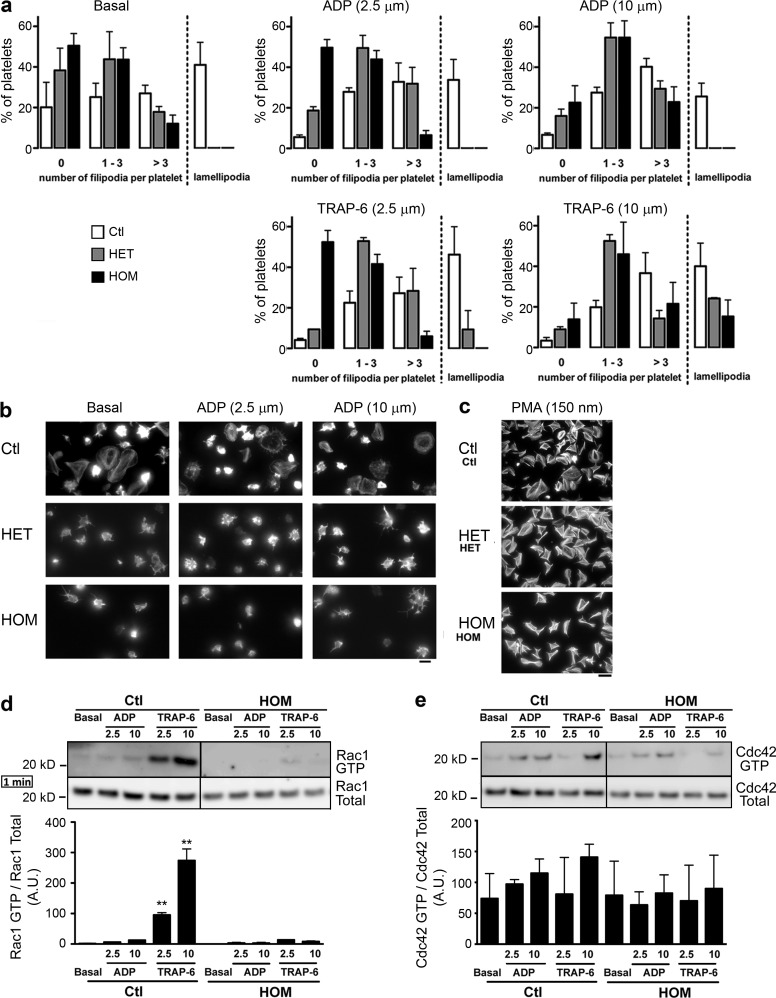
Figure 6.
Incomplete platelet spreading results from the p.G248W transition in CalDAG-GEFI. (a) Platelet spreading over immobilized fibrinogen from homozygous (HOM), heterozygous (HET), or healthy (Ctl) subjects. Representative results from two separate experiments, expressed as means ± SEM of 5 different view fields (Chi-squared test; for Ctl vs. HOM and Ctl vs. HET, P < 0.001 in all tested conditions; for HOM vs. HET: P < 0.001 for ADP 2.5 µM and TRAP-6 2.5 µM, P = 0.186 at basal state, P = 0.378 for ADP 10 µM, and P = 0.669 for TRAP-6 10 µM). (b and c) Representative images of platelet spreading from homozygous (HOM), heterozygous (HET) or healthy (Ctl) subjects in the presence of ADP and PMA (scale bars are 4 µm and 20 µm for b and c, respectively). (d and e) GTP loading shown for Rac1 and Cdc42 for platelets of HOM and Ctl subjects for ADP or TRAP-6 stimulation for 1 min. Representative blots of three independent experiments. Densitometry analysis shows the band density ratios of Rac1 GTP to total Rac1 and Cdc42 GTP to total Cdc42 as indicated in the panels below. Student’s t test revealed significant differences between control subject and homozygous patient platelet preparation treated with corresponding agonists (**, P > 0.001). Data are mean ± SEM; n = 3.

