Figure 2.
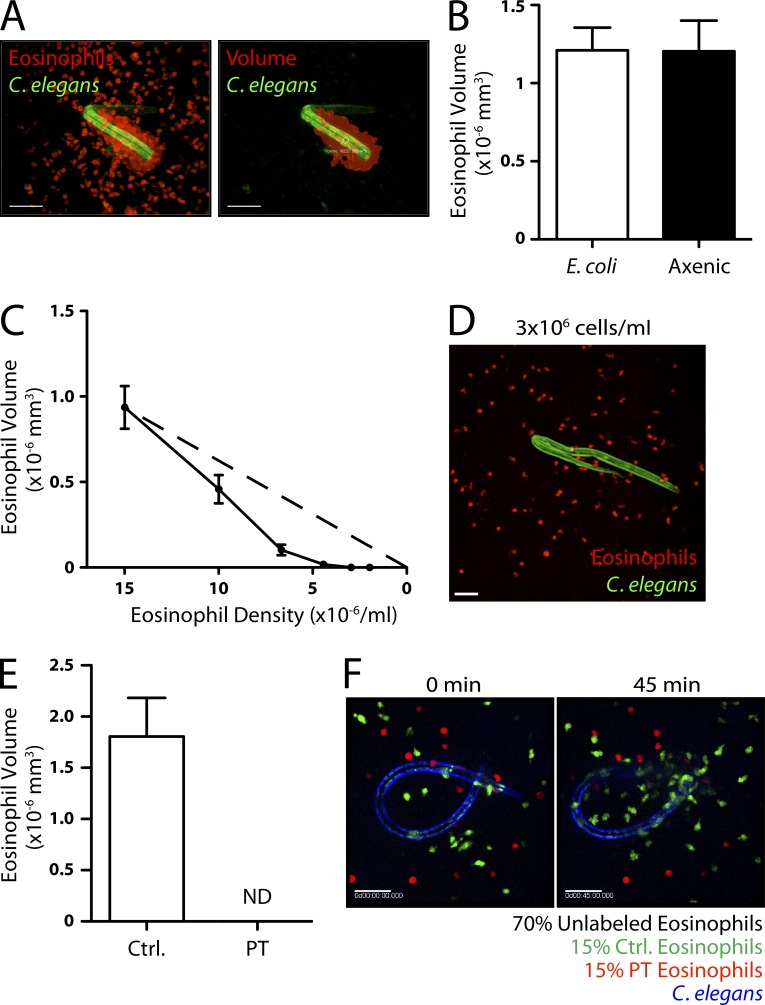
Evidence for paracrine signaling in collective eosinophil migration. (A) An example of a 3D eosinophil volume calculation using Imaris software. The raw image (left) and artificial volume (right) are shown. (B) Eosinophil accumulation around monoxenic C. elegans dauers grown on E. coli and dauers grown in axenic culture (n = 10). (C) Eosinophil accumulation as a function of eosinophil density (n = 10). The dashed line represents linear proportionality with an x intercept at the origin. (D) Eosinophils after 2 h of culture with dauers at a density of 3 × 10⁶ cells/ml. (E) Control and PT-treated eosinophil accumulation around C. elegans dauers (n = 6). (F) Images taken from a fluorescence microscopy time-lapse video (Video 4) of control and PT-treated eosinophils migrating toward a C. elegans dauer. The larva is shown at 0 min (left) and after 45 min (right) of culture. (A–F) Results represent three (A and B) or two (C–F) independent experiments. Error bars indicate standard error of the mean. Bars, 50 µm.

