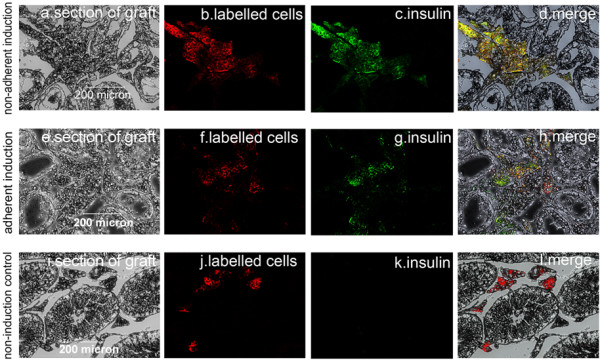
Figure 8.

Immunofluorescence examination of dewaxed sections of the grafts. Red CM-DiI-labeled cells in a graft section (A) in the nonadherent induction group were visualized only in the interstitial tissue among the seminiferous tubules (B) and showed green fluorophore (C) (merged in (D)) after staining with human insulin antibody under a fluoroscope. A similar phenomenon occurred in a graft section in the adherent induction group (E), (F), (G), (H), whereas CM-DiI-labeled cells in the non-induction control group did not express insulin (I), (J), (K), (L).
