Figure 3.
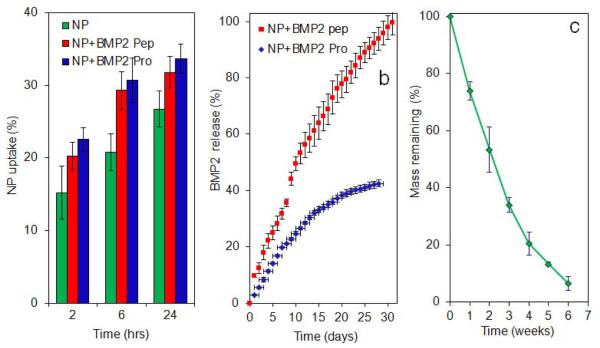
(a) Effect of BMP2 peptide or BMP2 protein grafted NPs on uptake of FITC-loaded NPs with incubation time; (b) release kinetics of BMP2 peptide (red) and BMP2 protein (enzymatically active, blue) with incubation time; (c) degradation kinetics (mass loss) of the NPs with incubation time. The star in Figure 3a indicates statistically significant difference (s.d.; p<0.05) between the uptake of peptide/protein grafted NPs and ungrafted NPs for a given time point. Error bars correspond to means ± 1 SD for n = 3.

