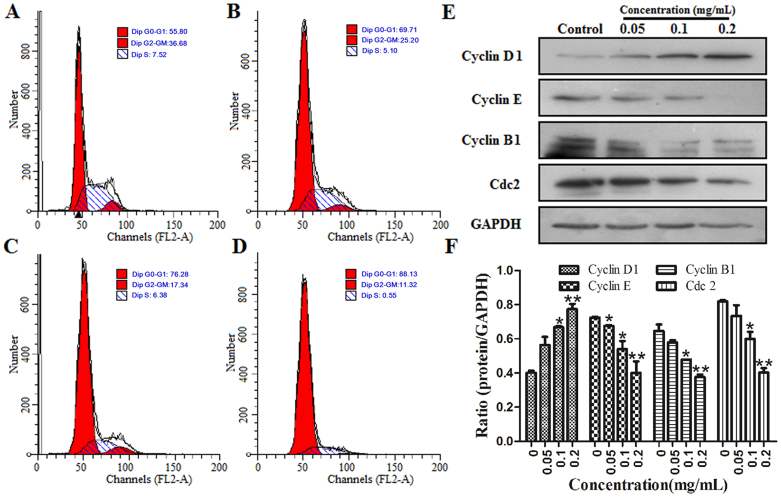
Figure 4. ESWE arrested SMMC-7721 cell cycle at the G1 phase.
Cells were treated with ESWE for 48 h and stained with PI. The cells were then analyzed by FACS. (A) Control. (B) 0.05 mg/mL. (C) 0.1 mg/mL. (D) 0.2 mg/mL. Data were expressed as percentage of cell population in G0-G1, S and G2-M phases of the cell cycle (n = 3). (E) Effect of ESWE on cycle proteins expression of Cyclin D1, Cyclin E, Cyclin B and Cdc2 by western blot analysis. Full-length blots are presented in Supplementary Figure 4E. (F) Quantitation data of (E). ESWE decreased the protein expressions of Cyclin E, Cyclin B and Cdc2 expressions, and increased Cyclin D1 expression in a dose-dependent manner compared to the untreated control. Data were expressed as means ± SD (n = 3). *p < 0.05, **p < 0.01 vs. the control group.

