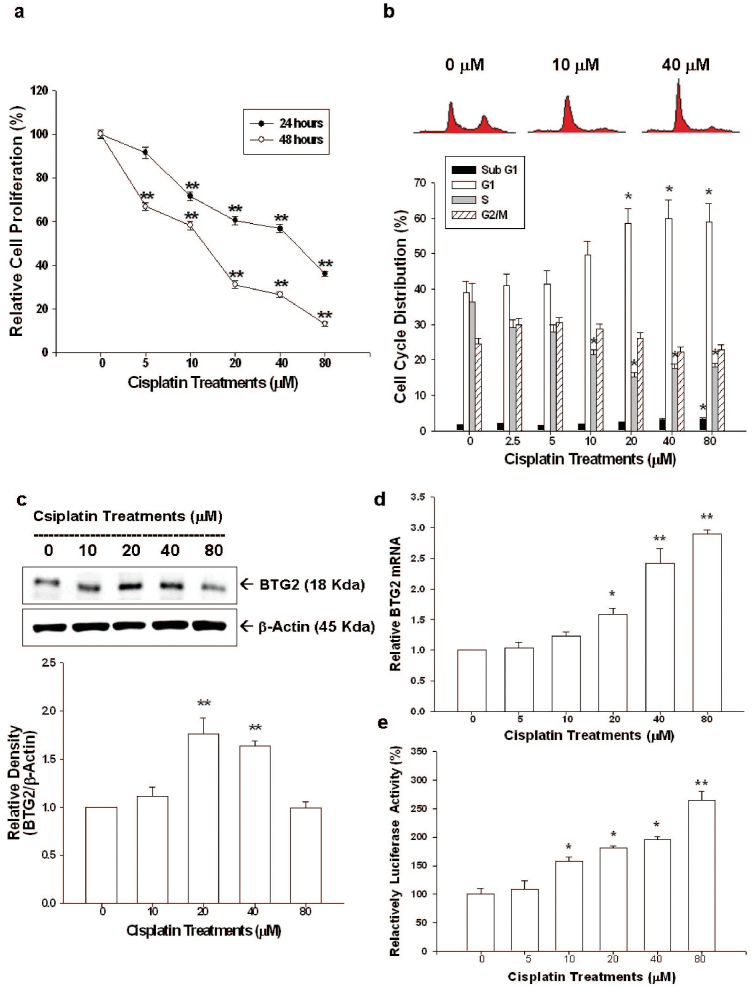
Figure 3. Cisplatin regulates cell proliferation, cell cycle progression and BTG2 expression in PC-3 cells.
(a) PC-3 cells were treated with various concentrations of cisplatin for 24 (black circle) or 48 (white circle) hours. Cell proliferation was determined by the H3-thymidine incorporation assay. (b) PC-3 cells were serum starved for 24 hours and then were treated with 0–80 μM of cisplatin as indicated for 24 hours. The cells were stained with PI, and the cell cycle distribution was analyzed by flow cytometry. Each box represents the mean ± SE (n = 6). PC-3 cells were treated with various concentrations of cisplatin as indicated for 24 hours. Expressions of BTG2 were determined by immunoblotting assays (c) (Cropped gel) and RT-qPCR (d). (e) Luciferase activity of BTG2 promoter vectors-transfected PC-3 cells treated with various concentrations of cisplatin. Each value is the % in relation to the control (solvent-treated) group. Data are presented as the mean percentage ± SE (n = 6). (*P < 0.05, **P < 0.01).

